pith. machine review for the scientific record. sign in

arxiv: 2604.16851 · v1 · submitted 2026-04-18 · 💻 cs.LG · cs.AI· cs.CV· q-bio.BM· q-bio.QM

Recognition: unknown

Applications of deep generative models to DNA reaction kinetics and to cryogenic electron microscopy

Authors on Pith no claims yet

Pith reviewed 2026-05-10 06:30 UTC · model grok-4.3

classification 💻 cs.LG cs.AIcs.CVq-bio.BMq-bio.QM
keywords deep generative modelsDNA reaction kineticsvariational autoencoderscryo-EM density mapsgenerative adversarial networksprotein structure modelinggeometric scattering transformsmultimodal U-Net
0
0 comments X

The pith

Biophysics-informed VAEs embed DNA reaction trajectories into interpretable pathways while GANs generate realistic cryo-EM density maps from protein structures.

A machine-rendered reading of the paper's core claim, the machinery that carries it, and where it could break.

The paper presents ViDa, a variational autoencoder framework that incorporates geometric scattering transforms to create embeddings of DNA reaction simulations. These embeddings are projected to two dimensions, preserving structural details and grouping trajectories into distinct reaction pathways for hybridization and strand displacement. It also introduces Struc2mapGAN to synthesize experimental-like cryo-EM maps directly from atomic protein structures and CryoSAMU, a structure-aware U-Net that refines intermediate-resolution maps by fusing density data with embeddings from protein language models via cross-attention. A review of deep learning methods for building atomic models from cryo-EM data is included with updated evaluation practices. These tools aim to bridge simulation data and experimental imaging in molecular biology by making complex kinetics and density maps easier to analyze and interpret.

Core claim

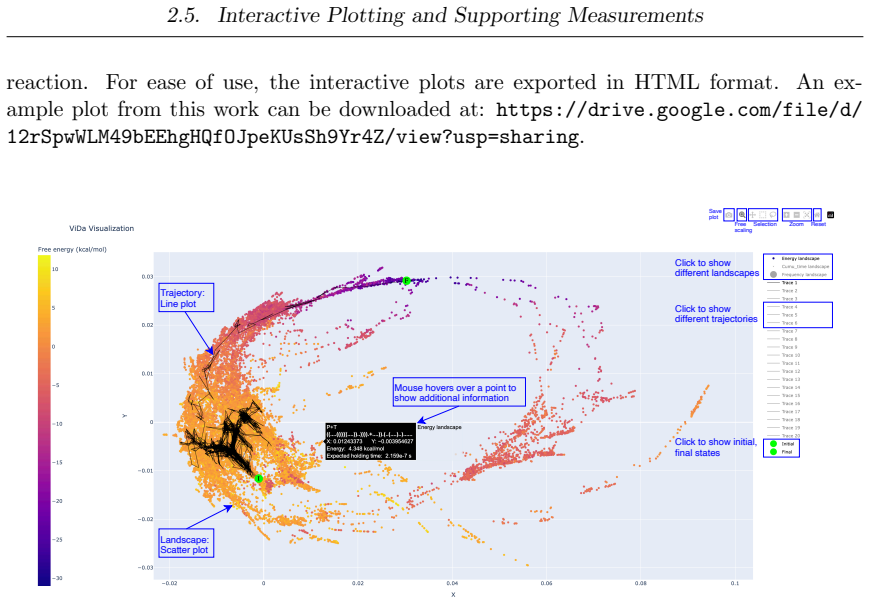
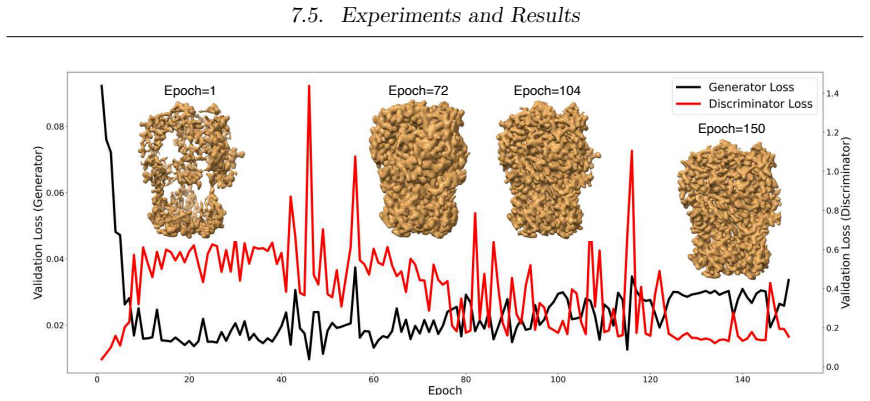
ViDa preserves structure in DNA reaction simulations by using biophysics-informed variational autoencoders and geometric scattering transforms to produce two-dimensional embeddings that cluster trajectory ensembles into reaction pathways, while Struc2mapGAN synthesizes high-fidelity experimental-like cryo-EM density maps from protein structures and CryoSAMU enhances intermediate-resolution maps through cross-attention integration of density features with structural embeddings.

What carries the argument

ViDa, the variational autoencoder with geometric scattering transforms for embedding DNA kinetics trajectories; Struc2mapGAN, the generative adversarial network for map synthesis; and CryoSAMU, the multimodal U-Net with cross-attention for map enhancement using protein embeddings.

If this is right

  • DNA reaction simulation results become more interpretable through two-dimensional visualization and pathway clustering.
  • New mechanistic insights into toehold-mediated strand displacement and hybridization reactions are obtained from the grouped trajectories.
  • High-fidelity cryo-EM density maps can be generated directly from known protein structures for comparison with experiments.
  • Intermediate-resolution cryo-EM maps are enhanced by integrating structural embeddings, aiding protein model building.
  • Improved metrics and guidance are provided for evaluating deep learning methods in atomic model construction from cryo-EM data.

Where Pith is reading between the lines

These are editorial extensions of the paper, not claims the author makes directly.

  • The embedding approach for simulations could extend to other molecular systems with known biophysical rules to improve interpretability.
  • Generated and enhanced maps may reduce reliance on extensive new experiments by providing synthetic references for structure validation.
  • Cross-attention fusion of pretrained protein models with experimental data suggests similar multimodal methods could apply to other imaging modalities in biology.

Load-bearing premise

The biophysics-informed embeddings accurately reflect true DNA reaction kinetics and the cross-attention fusion improves map quality without introducing artifacts.

What would settle it

Direct experimental validation showing that the reaction pathways clustered by ViDa fail to match observed DNA hybridization mechanisms or that Struc2mapGAN outputs differ systematically from real cryo-EM densities in blind tests.

Figures

Figures reproduced from arXiv: 2604.16851 by Chenwei Zhang.

Figure 1
Figure 1. Figure 1: The architecture of a semi-supervised VAE model, along with its asso [PITH_FULL_IMAGE:figures/full_fig_p014_1.png] view at source ↗
Figure 2
Figure 2. Figure 2: An instructional example showing how to use the designed interactive [PITH_FULL_IMAGE:figures/full_fig_p015_2.png] view at source ↗
Figure 3
Figure 3. Figure 3: Ablated ViDa’s visualization plots [PITH_FULL_IMAGE:figures/full_fig_p015_3.png] view at source ↗
Figure 3
Figure 3. Figure 3: Scatter plot comparison of local structure preservation across different [PITH_FULL_IMAGE:figures/full_fig_p016_3.png] view at source ↗
Figure 4
Figure 4. Figure 4 [PITH_FULL_IMAGE:figures/full_fig_p016_4.png] view at source ↗
Figure 4
Figure 4. Figure 4: ViDa-3Strand-generated secondary structure state space with states laid [PITH_FULL_IMAGE:figures/full_fig_p017_4.png] view at source ↗
Figure 6
Figure 6. Figure 6: Comparison of improved metrics (TMRR-score, C [PITH_FULL_IMAGE:figures/full_fig_p017_6.png] view at source ↗
Figure 6
Figure 6. Figure 6: Pairwise Pearson correlation scatter plots between corresponding im [PITH_FULL_IMAGE:figures/full_fig_p018_6.png] view at source ↗
Figure 7
Figure 7. Figure 7: The data preprocessing workflow. The top panel depicts the process of [PITH_FULL_IMAGE:figures/full_fig_p018_7.png] view at source ↗
Figure 7
Figure 7. Figure 7: The scatter plot of map generation time against the number of residues [PITH_FULL_IMAGE:figures/full_fig_p019_7.png] view at source ↗
Figure 7
Figure 7. Figure 7: The box-whisker plots for comparison among [PITH_FULL_IMAGE:figures/full_fig_p020_7.png] view at source ↗
Figure 1
Figure 1. Figure 1: a shows DNA hybridization and melting [PITH_FULL_IMAGE:figures/full_fig_p031_1.png] view at source ↗
Figure 1.1
Figure 1.1. Figure 1.1: (a) Helix association and dissociation reactions. The bottom pair of lines represents the two complementary strands with all bases paired (forming a double helix). (b) A toehold-mediated three-way strand displacement reaction. The two figures show coarse-grained representations of the reactions, i.e., it groups many elementary steps into one coarse-grained step. (c) A possible hairpin forming during heli… view at source ↗
Figure 1.2
Figure 1.2. Figure 1.2: Sample output data produced using the first step mode of Multistrand. the initial [5 ′-....(.((((..........)))).-3′+5′-.((((..........)))).)....-3′ ] and final [5 ′-(((((((((((((((((((((((((-3′+5′-)))))))))))))))))))))))))-3′ ] structures are represented in “dot-parenthesis” (dp) notation (see Supplementary A.1 for details). In this notation, matching parentheses indicate base pairs, dots represent unpai… view at source ↗
Figure 1.3
Figure 1.3. Figure 1.3: Coarse-grained visualization of a DNA hybridization reaction Gao-P4T4 (see [PITH_FULL_IMAGE:figures/full_fig_p037_1_3.png] view at source ↗
Figure 1.4
Figure 1.4. Figure 1.4: The architecture of a semi-supervised VAE model, along with its associated [PITH_FULL_IMAGE:figures/full_fig_p039_1_4.png] view at source ↗
Figure 2.1
Figure 2.1. Figure 2.1: The ViDa framework consists of several major parts: the Multistrand reac [PITH_FULL_IMAGE:figures/full_fig_p045_2_1.png] view at source ↗
Figure 2.2
Figure 2.2. Figure 2.2: An instructional example showing how to use the designed interactive plotting [PITH_FULL_IMAGE:figures/full_fig_p048_2_2.png] view at source ↗
Figure 3.1
Figure 3.1. Figure 3.1: ViDa embedding results for Gao-P4T4. Each point represents a secondary structure state. The green circle marked I (F) denotes the initial (final) state. (a) 2D embedding of secondary structure states. The color of each state refers to its free energy. The red and cyan traces represent two different trajectory samples. (b) Results of density-based spatial clustering of applications with noise (DBSCAN) [58… view at source ↗
Figure 3.2
Figure 3.2. Figure 3.2: Scatter plot comparison of local structure preservation across different em￾bedding methods, including ViDa, PCA, PHATE, UMAP, t-SNE, and MDS. The figure illustrates the average difference in (a) energy and (b) graph edit distance (GED) be￾tween original state and their K nearest neighbours in the embedding space, for K = {10, 50, 100, 200, 500, 1000, 2000, 3000, 4000, 5000}. The corresponding numerical … view at source ↗
Figure 3.3
Figure 3.3. Figure 3.3: Ablated ViDa’s visualization plots: (a) ViDa noGED, (b) ViDa noMPT, (c) ViDa noMPT noGED, and (d) ViDa noG noMPT noGED. Trajectories laid out on the embedding for Gao-P4T4. Each point represents a secondary structure state. The color of each point represents the value of free energy. The cyan and red traces represent two distinct trajectory samples, corresponding to the same samples shown in [PITH_FULL_… view at source ↗
Figure 3.4
Figure 3.4. Figure 3.4: Scatter plot comparison of local structure preservation across different ab [PITH_FULL_IMAGE:figures/full_fig_p058_3_4.png] view at source ↗
Figure 3.5
Figure 3.5. Figure 3.5: ViDa embedding results for Hata-39. Each point represents a secondary structure state. The green circle marked F denotes the final (hybridized) state. (a) 2D embedding of secondary structure states. The color of each state refers to its structural type [29]. For instance, SM0 denotes the type of secondary structure states with at least one stack, at least one mis-stack, and no hairpins. There are eight s… view at source ↗
Figure 4.1
Figure 4.1. Figure 4.1: (a) ViDa-3Strand-generated secondary structure state space with states laid out on the energy landscape for the perfect-toehold8 reaction. Each point refers to a state with the color representing the value of free energy. The green blobs annotated by “I” and “F” indicate specific initial and successful final states, respectively. (b) and (c) show representative failed and successful trajectories, respect… view at source ↗
Figure 4.2
Figure 4.2. Figure 4.2: (a) ViDa-3Strand-generated secondary structure state space with states laid out on the energy landscape for the perfect-toehold7-reporter reaction. Each point refers to a state with the color representing the value of free energy. The green blobs annotated by “I” and “F” indicate specific initial and successful final states, respectively. (b) and (c) show representative failed and successful trajectories… view at source ↗
Figure 4
Figure 4. Figure 4: shows the secondary structure state space overlaid with both successful and [PITH_FULL_IMAGE:figures/full_fig_p069_4.png] view at source ↗
Figure 4.3
Figure 4.3. Figure 4.3: ViDa-3Strand-generated secondary structure state space with states laid out on the energy landscape for the proximal-toehold8 reaction. Each point refers to a state with the color representing the value of free energy. The tables in (a) and (b) show corresponding dot-parenthesis notation, cumulative time, and free energy of the selected states. Mis-stacked base pairs and fully paired toeholds are highlig… view at source ↗
Figure 4.4
Figure 4.4. Figure 4.4: ViDa-3Strand-generated secondary structure state space with states laid out [PITH_FULL_IMAGE:figures/full_fig_p071_4_4.png] view at source ↗
Figure 5.2
Figure 5.2. Figure 5.2: DL-based approaches (a) direct model building and (b) indirect model building. Note that the illustration of indirect model-building approaches represents an overview of some of the approaches. The illustrated protein complex structure is the SARS-CoV￾2 spike in complex with antibodies B1-182.1 and A19-61.1 (PDB-ID: 7TBF; EMDB-ID: 25797; Resolution: 3.1 ˚A) [132]. Direct model building Some methods ([76,… view at source ↗
Figure 5.3
Figure 5.3. Figure 5.3: The architecture of the GAN model. 57 [PITH_FULL_IMAGE:figures/full_fig_p082_5_3.png] view at source ↗
Figure 6.1
Figure 6.1. Figure 6.1: Bar chart: cumulative number of all EMDB entries and of those with an associated atomic structure in the PDB at the end of each year. Line plot: number of annually released EMDB and PDB entries. Data is shown until the end of 2024. The statistics were collected from EMDB on 2025-01-09 [89]. CNN Convolutional neural networks (CNNs) [173] excel in 2D image classification and have been extended to 3D densit… view at source ↗
Figure 6.2
Figure 6.2. Figure 6.2: Comparison of prediction scores using different evaluation metrics. (a) The overall topology of the Phenix-predicted protein structure closely resembles that of the target one. However, the folding patterns of the predicted protein chains are distinctly different. Existing metrics, such as those outlined by ModelAngelo [122], do not account for chain correspondence, thereby resulting in very high precisi… view at source ↗
Figure 6.3
Figure 6.3. Figure 6.3: Comparison of improved metrics (TMRR-score, C [PITH_FULL_IMAGE:figures/full_fig_p096_6_3.png] view at source ↗
Figure 6.4
Figure 6.4. Figure 6.4: Pairwise Pearson correlation scatter plots between corresponding improved [PITH_FULL_IMAGE:figures/full_fig_p097_6_4.png] view at source ↗
Figure 6.5
Figure 6.5. Figure 6.5: The heat map for the TMRR-score of 50 protein models generated by Phenix, Mod￾elAngelo, EMBuild, and DeepMainmast, sorted by their map resolution from high to low. The darker color refers to the higher score. The value in each cell represents the specific score for the generated model. The left labels show the resolutions and the right labels show the PDB IDs of each generated model. 74 [PITH_FULL_IMAGE… view at source ↗
Figure 6
Figure 6. Figure 6: a shows that DeepMainmast outperformed DeepMainmast-Base across all four [PITH_FULL_IMAGE:figures/full_fig_p100_6.png] view at source ↗
Figure 6.6
Figure 6.6. Figure 6.6: a-c Constructed protein atomic models by ModelAngelo (red), EMBuild (blue), and DeepMainmast (purple), respectively, with cryo-EM density maps (transparent gray) and the corre￾sponding reference PDB structures (cyan). Each TMRR-score value is shown at the bottom of the model. Black boxes highlight the poorly modeled regions. (a) Phosphorylated, ATP-bound struc￾ture of zebrafish cystic fibrosis transmembr… view at source ↗
Figure 6.7
Figure 6.7. Figure 6.7: (a) Comparison of four metrics (TMRR-score, Cα Precision, Cα Recall, and Cα F1-score) of 50 protein models generated by DeepMainmast and DeepMainmast-Base. The dots represent the scores for each protein model. (b) Left: the reference PDB structure colored in cyan superimposes onto the corresponding cryo-EM density map colored in transparent gray. Right: the superimposed constructed atomic models by DeepM… view at source ↗
Figure 7.1
Figure 7.1. Figure 7.1: The data preprocessing workflow. The top panel depicts the process of curating [PITH_FULL_IMAGE:figures/full_fig_p106_7_1.png] view at source ↗
Figure 7
Figure 7. Figure 7: depicts the GAN architecture that comprises a generator and a discrimina [PITH_FULL_IMAGE:figures/full_fig_p107_7.png] view at source ↗
Figure 7.2
Figure 7.2. Figure 7.2: The struc2mapGAN architecture. The bottom panel illustrates the U-Net++ architecture. Xi,j refers to the convolution block at depth i and position j of the network. The discriminator network has been designed for 3D volumetric data classification. It consists of four 3D convolution layers with a kernel size of 3 × 3 × 3. An adaptive average￾pooling layer is applied after the last convolution layer to red… view at source ↗
Figure 7.3
Figure 7.3. Figure 7.3: The validation losses of both the generator (black) and discriminator (red) were [PITH_FULL_IMAGE:figures/full_fig_p111_7_3.png] view at source ↗
Figure 7.3
Figure 7.3. Figure 7.3: Validation loss curves of the generator and discriminator in black and red, [PITH_FULL_IMAGE:figures/full_fig_p112_7_3.png] view at source ↗
Figure 7.4
Figure 7.4. Figure 7.4: Examples of struc2mapGAN (gray) and molmap (cyan) generated maps, and the raw experimental maps (orange). The PDB structures of α-helices (pink) and β-sheets (blue) are superimposed on the maps. a. Human STEAP4 bound to NADP, FAD, heme and Fe(III)-NTA (EMDB ID: 0199; PDB ID: 6HCY; reported resolution: 3.1 ˚A) [207]. b. AAA+ ATPase, ClpL from Streptococcus pneumoniae: ATPrS-bound (EMDB ID: 0967; PDB ID: 6… view at source ↗
Figure 7.5
Figure 7.5. Figure 7.5: Struc2mapGAN-generated map is shown in blue, and molmap-simulated maps [PITH_FULL_IMAGE:figures/full_fig_p114_7_5.png] view at source ↗
Figure 7.6
Figure 7.6. Figure 7.6: The scatter plots for comparison of ChimeraX correlation (left) and SSIM [PITH_FULL_IMAGE:figures/full_fig_p115_7_6.png] view at source ↗
Figure 7
Figure 7. Figure 7: ). This mismatch reduces voxel-wise correlation despite the apparent precision of [PITH_FULL_IMAGE:figures/full_fig_p115_7.png] view at source ↗
Figure 7.7
Figure 7.7. Figure 7.7: The box-whisker plots for comparison of different methods ( [PITH_FULL_IMAGE:figures/full_fig_p116_7_7.png] view at source ↗
Figure 7
Figure 7. Figure 7: shows the wall-clock time plotted against the number of residues of each candi [PITH_FULL_IMAGE:figures/full_fig_p117_7.png] view at source ↗
Figure 7.8
Figure 7.8. Figure 7.8: The scatter plot of map generation time against the number of residues in [PITH_FULL_IMAGE:figures/full_fig_p118_7_8.png] view at source ↗
Figure 7.9
Figure 7.9. Figure 7.9: The box-whisker plots for comparison among [PITH_FULL_IMAGE:figures/full_fig_p119_7_9.png] view at source ↗
Figure 8.1
Figure 8.1. Figure 8.1: Overview of the CryoSAMU framework. a Generating protein multimodal representations: structure features are derived from a frozen pretrained ESM-IF1 model with self-attention weighting for a fixed-size representation; map voxel features are sim￾ulated via resolution-lowering point spread function and partitioned into smaller cubes. b The CryoSAMU architecture. The experimental map is partitioned into sma… view at source ↗
Figure 8.2
Figure 8.2. Figure 8.2: Visual and quantitative comparison of deposited (blue) and CryoSAMU [PITH_FULL_IMAGE:figures/full_fig_p129_8_2.png] view at source ↗
Figure 8
Figure 8. Figure 8: a. In contrast, the CryoSAMU-enhanced maps exhibited better alignment with [PITH_FULL_IMAGE:figures/full_fig_p129_8.png] view at source ↗
Figure 8.3
Figure 8.3. Figure 8.3: The violin plots for comparison of different methods across four evaluation [PITH_FULL_IMAGE:figures/full_fig_p131_8_3.png] view at source ↗
Figure 8
Figure 8. Figure 8: c and d. CryoSAMU achieved the highest residue coverage score among all [PITH_FULL_IMAGE:figures/full_fig_p132_8.png] view at source ↗
Figure 8.4
Figure 8.4. Figure 8.4: a-b: The polar plots for comparison of protein structures constructed from deposited (blue) and CryoSAMU-enhanced (green) maps, using metrics of (a) residue cov￾erage and (b) sequence match. c-d: The box-whisker plots for comparison of different methods across two evaluation metrics over 20 test samples. 108 [PITH_FULL_IMAGE:figures/full_fig_p133_8_4.png] view at source ↗
Figure 8.5
Figure 8.5. Figure 8.5: The scatter plot of map processing time against map volume. Each dot rep [PITH_FULL_IMAGE:figures/full_fig_p135_8_5.png] view at source ↗
Figure 8
Figure 8. Figure 8: shows that CryoSAMU (w/) outperforms CryoSAMU (w/o) in both CC [PITH_FULL_IMAGE:figures/full_fig_p135_8.png] view at source ↗
Figure 8.6
Figure 8.6. Figure 8.6: Pairwise comparison of enhanced/deposited ratios for CryoSAMU (w/) and [PITH_FULL_IMAGE:figures/full_fig_p136_8_6.png] view at source ↗
read the original abstract

This dissertation explores how deep generative models can advance the analysis of challenging biological problems by integrating domain knowledge with deep learning. It focuses on two areas: DNA reaction kinetics and cryogenic electron microscopy (cryo-EM). In the first part, we present ViDa, a biophysics-informed framework leveraging variational autoencoders (VAEs) and geometric scattering transforms to generate biophysically-plausible embeddings of DNA reaction kinetics simulations. These embeddings are reduced to a two-dimensional space to visualize DNA hybridization and toehold-mediated strand displacement reactions. ViDa preserves structure and clusters trajectory ensembles into reaction pathways, making simulation results more interpretable and revealing new mechanistic insights. In the second part, we address key challenges in cryo-EM density map interpretation and protein structure modeling. We provide a comprehensive review and benchmarking of deep learning methods for atomic model building, with improved evaluation metrics and practical guidance. We then present Struc2mapGAN, a generative adversarial network that synthesizes high-fidelity experimental-like cryo-EM density maps from protein structures. Finally, we present CryoSAMU, a structure-aware multimodal U-Net that enhances intermediate-resolution cryo-EM maps by integrating density features with structural embeddings from protein language models via cross-attention. Overall, these contributions demonstrate the potential of deep generative models to interpret DNA reaction mechanisms and advance cryo-EM density map analysis and protein structure modeling.

Editorial analysis

A structured set of objections, weighed in public.

Desk editor's note, referee report, simulated authors' rebuttal, and a circularity audit. Tearing a paper down is the easy half of reading it; the pith above is the substance, this is the friction.

Referee Report

3 major / 1 minor

Summary. This dissertation applies deep generative models to DNA reaction kinetics and cryo-EM. It introduces ViDa, which combines variational autoencoders with geometric scattering transforms to produce 2D embeddings of DNA hybridization and toehold-mediated strand displacement simulation trajectories, claiming these embeddings preserve structure, cluster trajectories into reaction pathways, and yield new mechanistic insights. It also provides a review and benchmarking of deep learning methods for atomic model building in cryo-EM, introduces Struc2mapGAN to synthesize high-fidelity experimental-like density maps from protein structures, and presents CryoSAMU, a structure-aware multimodal U-Net that integrates density features with protein language model embeddings via cross-attention to enhance intermediate-resolution maps.

Significance. If the quantitative claims hold, ViDa could improve interpretability of molecular dynamics trajectories for nucleic acid reactions, while Struc2mapGAN and CryoSAMU could supply useful synthetic data and enhancement tools for cryo-EM structure determination. The biophysics-informed embedding approach and cross-attention integration represent a reasonable attempt to fuse domain knowledge with generative models. However, the absence of any reported metrics, baselines, or validation experiments in the abstract makes the practical significance difficult to assess at present.

major comments (3)
  1. [Abstract] Abstract: the central claims that ViDa 'preserves structure and clusters trajectory ensembles into reaction pathways' and 'revealing new mechanistic insights' are stated without any quantitative metrics, validation against known rate constants, transition-state ensembles, or baseline comparisons. This absence is load-bearing for the ViDa contribution.
  2. [ViDa framework] ViDa description: geometric scattering transforms are applied to time-series of DNA conformations, yet these operators are designed primarily for static point clouds and average over neighborhoods; the manuscript provides no explicit test showing that rare, high-energy transition configurations are retained rather than suppressed, which directly affects whether the observed 2D clusters reflect kinetic pathways or equilibrium structural similarity.
  3. [Cryo-EM contributions] Struc2mapGAN and CryoSAMU sections: assertions of 'high-fidelity experimental-like' maps and 'meaningfully improves map quality' lack reported quantitative measures such as FSC curves, resolution estimates, or artifact quantification against experimental references, which are required to support the generative modeling claims.
minor comments (1)
  1. [Benchmarking review] The benchmarking section for atomic model building would be strengthened by explicit listing of the improved evaluation metrics and the precise criteria used for 'practical guidance'.

Simulated Author's Rebuttal

3 responses · 0 unresolved

We thank the referee for their constructive comments on our dissertation. We respond to each major comment below and indicate the revisions we will make to strengthen the manuscript.

read point-by-point responses
  1. Referee: [Abstract] Abstract: the central claims that ViDa 'preserves structure and clusters trajectory ensembles into reaction pathways' and 'revealing new mechanistic insights' are stated without any quantitative metrics, validation against known rate constants, transition-state ensembles, or baseline comparisons. This absence is load-bearing for the ViDa contribution.

    Authors: The abstract provides a high-level overview of the work, while the detailed quantitative metrics, including clustering performance, comparisons to known rate constants, and validation of transition states, are presented in the main body of the dissertation. To address the referee's concern, we will revise the abstract to include brief references to these quantitative validations. revision: yes

  2. Referee: [ViDa framework] ViDa description: geometric scattering transforms are applied to time-series of DNA conformations, yet these operators are designed primarily for static point clouds and average over neighborhoods; the manuscript provides no explicit test showing that rare, high-energy transition configurations are retained rather than suppressed, which directly affects whether the observed 2D clusters reflect kinetic pathways or equilibrium structural similarity.

    Authors: We note that the geometric scattering transforms are used to extract multi-scale features from each conformation in the trajectory, and the variational autoencoder is trained on the full time-series to capture temporal dynamics. Although an explicit test for retention of rare high-energy configurations is not detailed in the current manuscript, the 2D embeddings demonstrate clustering consistent with known kinetic pathways rather than just equilibrium structures. We will add an explicit analysis or discussion of this point in the revised manuscript. revision: partial

  3. Referee: [Cryo-EM contributions] Struc2mapGAN and CryoSAMU sections: assertions of 'high-fidelity experimental-like' maps and 'meaningfully improves map quality' lack reported quantitative measures such as FSC curves, resolution estimates, or artifact quantification against experimental references, which are required to support the generative modeling claims.

    Authors: Quantitative measures including FSC curves, resolution estimates, and comparisons to experimental references are provided in the results sections for both Struc2mapGAN and CryoSAMU. We will revise the manuscript to more prominently feature these metrics, perhaps with a dedicated table, to better support the claims. revision: yes

Circularity Check

0 steps flagged

No circularity: descriptive application of existing generative models with no load-bearing derivations or self-referential reductions.

full rationale

The manuscript presents ViDa (VAE + geometric scattering for DNA trajectory embeddings), Struc2mapGAN, and CryoSAMU as applied frameworks without exhibiting any mathematical derivation chains, equations, or fitted-parameter predictions that reduce to their own inputs by construction. No self-citations, uniqueness theorems, or ansatzes are invoked in a load-bearing way; the work is empirical and architectural rather than deductive. The central claims rest on model performance and visualization rather than any step that is definitionally equivalent to its premise.

Axiom & Free-Parameter Ledger

0 free parameters · 0 axioms · 0 invented entities

Abstract-only view provides no explicit free parameters, axioms, or invented entities; all technical details are absent.

pith-pipeline@v0.9.0 · 5549 in / 1087 out tokens · 31985 ms · 2026-05-10T06:30:11.045836+00:00 · methodology

discussion (0)

Sign in with ORCID, Apple, or X to comment. Anyone can read and Pith papers without signing in.

Reference graph

Works this paper leans on

19 extracted references · 2 canonical work pages · 1 internal anchor

  1. [1]

    The abtem code: transmission electron microscopy from first principles.Open Research Europe, 1:24, 2021

    Jacob Madsen and Toma Susi. The abtem code: transmission electron microscopy from first principles.Open Research Europe, 1:24, 2021

  2. [2]

    Image formation modeling in cryo-electron microscopy.Journal of structural biology, 183(1):19–32, 2013

    Miloˇ s Vulovi´ c, Raimond BG Ravelli, Lucas J van Vliet, Abraham J Koster, Ivan Lazi´ c, Uwe L¨ ucken, Hans Rullg˚ ard, Ozan¨Oktem, and Bernd Rieger. Image formation modeling in cryo-electron microscopy.Journal of structural biology, 183(1):19–32, 2013

  3. [3]

    Could egg white lysozyme be solved by single particle cryo-em?Journal of chemical information and modeling, 60(5):2605–2613, 2020

    Yue Zhang, R Tammaro, Peter J Peters, and RBG Ravelli. Could egg white lysozyme be solved by single particle cryo-em?Journal of chemical information and modeling, 60(5):2605–2613, 2020

  4. [4]

    Film: Visual reasoning with a general conditioning layer

    Ethan Perez, Florian Strub, Harm De Vries, Vincent Dumoulin, and Aaron Courville. Film: Visual reasoning with a general conditioning layer. InProceedings of the AAAI conference on artificial intelligence, volume 32, pages 3942–3951, 2018

  5. [5]

    Single-particle cryo-em—how did it get here and where will it go

    Yifan Cheng. Single-particle cryo-em—how did it get here and where will it go. Science, 361(6405):876–880, 2018

  6. [6]

    Principles of cryo-em single-particle image processing.Journal of Electron Microscopy, 65(1):57–67, 2015

    Fred J Sigworth. Principles of cryo-em single-particle image processing.Journal of Electron Microscopy, 65(1):57–67, 2015

  7. [7]

    Jochen B¨ ohm, Achilleas S Frangakis, Reiner Hegerl, Stephan Nickell, Dieter Typke, and Wolfgang Baumeister. Toward detecting and identifying macromolecules in a cellular context: template matching applied to electron tomograms.Proceedings of the National Academy of Sciences, 97(26):14245–14250, 2000

  8. [8]

    Automatic local resolution-based sharpening of cryo-em maps.Bioin- formatics, 36(3):765–772, 2020

    Erney Ram´ ırez-Aportela, Jose Luis Vilas, Alisa Glukhova, Roberto Melero, Pablo Conesa, Marta Mart´ ınez, David Maluenda, Javier Mota, Amaya Jim´ enez, Javier Vargas, et al. Automatic local resolution-based sharpening of cryo-em maps.Bioin- formatics, 36(3):765–772, 2020

  9. [9]

    Atypical structural snapshots of human cytomegalovirus gpcr interactions with host g proteins.Science advances, 8(3):eabl5442, 2022

    Naotaka Tsutsumi, Shoji Maeda, Qianhui Qu, Martin V¨ ogele, Kevin M Jude, Carl- Mikael Suomivuori, Ouliana Panova, Deepa Waghray, Hideaki E Kato, Andrew Ve- lasco, et al. Atypical structural snapshots of human cytomegalovirus gpcr interactions with host g proteins.Science advances, 8(3):eabl5442, 2022

  10. [10]

    Sigmoid-weighted linear units for neural network function approximation in reinforcement learning.Neural networks, 107:3– 11, 2018

    Stefan Elfwing, Eiji Uchibe, and Kenji Doya. Sigmoid-weighted linear units for neural network function approximation in reinforcement learning.Neural networks, 107:3– 11, 2018

  11. [11]

    Trans- formers are rnns: Fast autoregressive transformers with linear attention

    Angelos Katharopoulos, Apoorv Vyas, Nikolaos Pappas, and Fran¸ cois Fleuret. Trans- formers are rnns: Fast autoregressive transformers with linear attention. InInterna- tional conference on machine learning, pages 5156–5165. PMLR, 2020. 132

  12. [12]

    Auxiliary modality learning with generalized curriculum distillation

    Yu Shen, Xijun Wang, Peng Gao, and Ming Lin. Auxiliary modality learning with generalized curriculum distillation. InInternational Conference on Machine Learn- ing, pages 31057–31076. PMLR, 2023

  13. [13]

    Decoupled Weight Decay Regularization

    Ilya Loshchilov and Frank Hutter. Decoupled weight decay regularization.arXiv preprint arXiv:1711.05101, 2017

  14. [14]

    New tools for the analysis and validation of cryo-em maps and atomic models.Acta Crystallographica Section D: Structural Biology, 74(9):814–840, 2018

    Pavel V Afonine, Bruno P Klaholz, Nigel W Moriarty, Billy K Poon, Oleg V Sobolev, Thomas C Terwilliger, Paul D Adams, and Alexandre Urzhumtsev. New tools for the analysis and validation of cryo-em maps and atomic models.Acta Crystallographica Section D: Structural Biology, 74(9):814–840, 2018

  15. [15]

    Structure of the transporter associated with antigen processing trapped by herpes simplex virus.Elife, 5:e21829, 2016

    Michael L Oldham, Nikolaus Grigorieff, and Jue Chen. Structure of the transporter associated with antigen processing trapped by herpes simplex virus.Elife, 5:e21829, 2016

  16. [16]

    Tir-catalyzed adp-ribosylation re- actions produce signaling molecules for plant immunity.Science, 377(6605):eabq8180, 2022

    Aolin Jia, Shijia Huang, Wen Song, Junli Wang, Yonggang Meng, Yue Sun, Lina Xu, Henriette Laessle, Jan Jirschitzka, Jiao Hou, et al. Tir-catalyzed adp-ribosylation re- actions produce signaling molecules for plant immunity.Science, 377(6605):eabq8180, 2022

  17. [17]

    Structure of human dispatched-1 pro- vides insights into hedgehog ligand biogenesis.Life science alliance, 3(8), 2020

    Hongwen Chen, Yang Liu, and Xiaochun Li. Structure of human dispatched-1 pro- vides insights into hedgehog ligand biogenesis.Life science alliance, 3(8), 2020

  18. [18]

    Computational design of transmembrane pores.Nature, 585(7823):129–134, 2020

    Chunfu Xu, Peilong Lu, Tamer M Gamal El-Din, Xue Y Pei, Matthew C Johnson, Atsuko Uyeda, Matthew J Bick, Qi Xu, Daohua Jiang, Hua Bai, et al. Computational design of transmembrane pores.Nature, 585(7823):129–134, 2020

  19. [19]

    +” sign corresponds to strandPand the right part corresponds to strand ¯P. Three open paren- theses indicate that the bases “CGA

    Jun-Jie Liu, Chu-Ya Niu, Yao Wu, Dan Tan, Yang Wang, Ming-Da Ye, Yang Liu, Wenwei Zhao, Ke Zhou, Quan-Sheng Liu, et al. Cryoem structure of yeast cytoplas- mic exosome complex.Cell research, 26(7):822–837, 2016. 133 Appendix A Supplementary Materials for Chapter 1 A.1 Dot-Parenthesis Notation Dot-parenthesis (dp) notation is a simple way to represent a ps...