Recognition: unknown
Backlighting the Cosmic Web with Fast Radio Bursts: An Anthology of Dispersion Measure Cross-Correlations with Large-Scale Structure and Baryon Tracers
Pith reviewed 2026-05-08 13:55 UTC · model grok-4.3
The pith
FRB dispersion measures correlate with large-scale structure tracers, matching moderate baryon feedback models.
A machine-rendered reading of the paper's core claim, the machinery that carries it, and where it could break.
Core claim
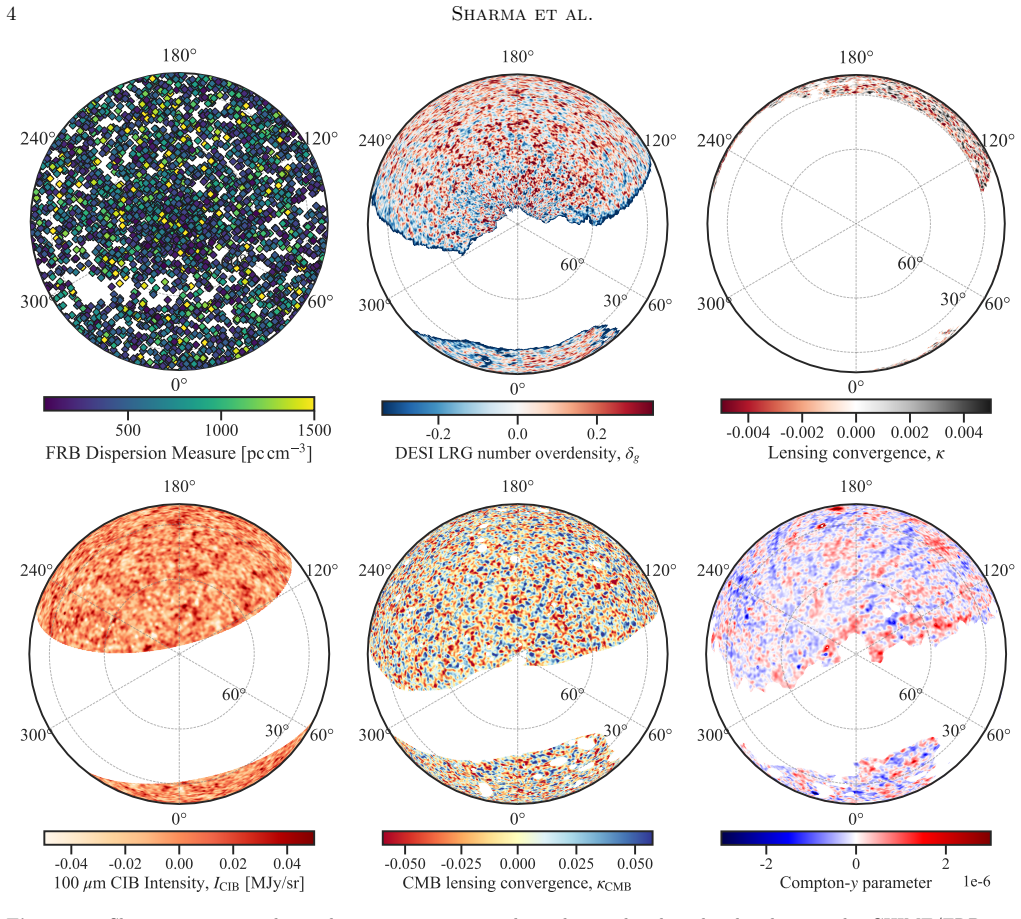
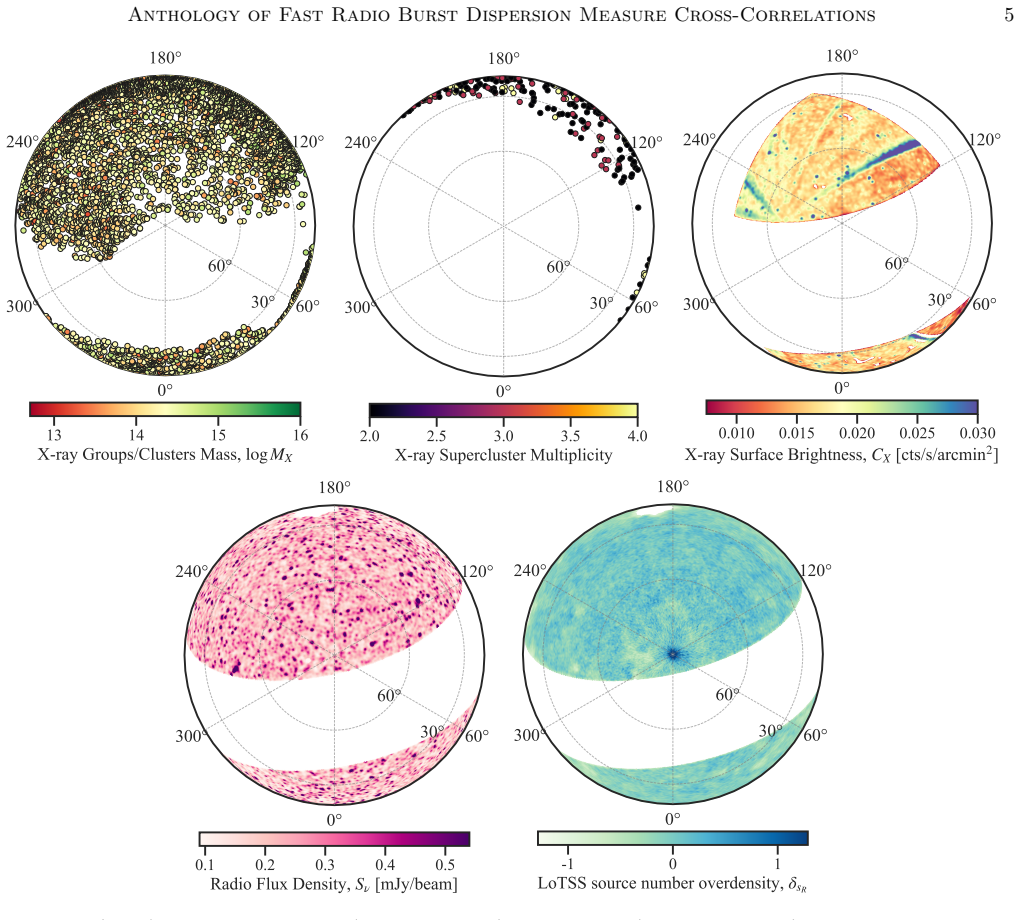
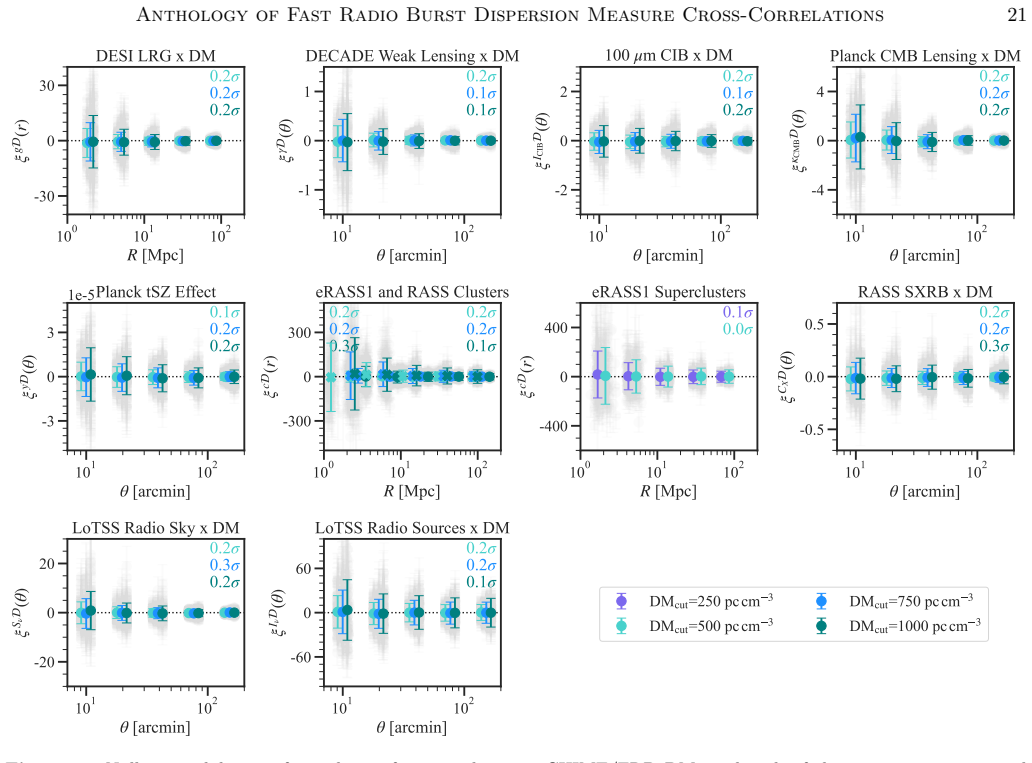
Using 3455 FRBs, the authors measure correlations of dispersion measures with galaxies, weak lensing, cosmic infrared background, CMB lensing, thermal Sunyaev-Zel'dovich effect, X-ray emission from clusters and superclusters, soft X-ray background, and radio continuum, reaching 2.6 to 5 sigma significance. These correlations establish that FRB sightlines through overdense regions carry larger dispersion measures. The amplitudes of the thermal Sunyaev-Zel'dovich and soft X-ray background cross-correlations agree with a baryon-distribution model inferred from the dispersion-measure redshift relation under moderate feedback at the 0.5 sigma level, while a weaker-feedback scenario is excluded at
What carries the argument
Cross-correlation of FRB dispersion measures, which integrate electron column density, with tracers of large-scale structure and especially hot baryonic gas to test feedback strength.
Load-bearing premise
The observed dispersion-measure correlations arise mainly from the intergalactic medium rather than residual contributions from host galaxies or local environments, and the dispersion-measure redshift relation used to build the model is independent of the correlation measurements.
What would settle it
An independent measurement of the soft X-ray background times dispersion-measure correlation amplitude that deviates by more than three sigma from the moderate-feedback prediction would falsify the central conclusion.
Figures


read the original abstract
Fast Radio Bursts (FRBs) probe baryons permeating the cosmic web through their dispersion measures (DMs), which encode the integrated electron density along cosmological sightlines. Using 3,455 unique FRB sources from CHIME/FRB with $\sim 15$ arcmin localizations, we present an anthology of DM correlations with tracers of large-scale structure and baryonic matter at redshifts $z \lesssim 1.5$. We measure statistically significant correlations at $2.6-5\sigma$ with ten probes, including galaxies ($2.8\sigma$), weak gravitational lensing ($2.6\sigma$), cosmic infrared background ($4.0\sigma$), cosmic microwave background (CMB) lensing ($3.3\sigma$), thermal Sunyaev Zel'dovich (tSZ) effect ($3.8\sigma$), X-ray emission tracing galaxy clusters ($5.0\sigma$) and superclusters ($3.3\sigma$), soft X-ray background (SXRB, $4.1\sigma$), and radio continuum emission ($3.2\sigma$). These measurements reveal a consistent picture in which FRB sightlines intersecting overdense environments carry systematically larger DMs. Correlations with hot-gas tracers provide additional leverage on the strength of feedback, as they are strongly weighted towards the dense, bound gas. The measured amplitude of tSZ$\times$DM and SXRB$\times$DM correlations are consistent with theoretical predictions of baryon distribution from a DM-$z$ relation-inferred model with moderate feedback at $\sim 0.5\sigma$ level. Weaker feedback scenario is ruled out at $\sim 3.5\sigma$ by the SXRB$\times$DM correlation. Taken together, these measurements constitute a quantitative multi-tracer foundation for a new era in which FRBs from next generation facilities, such as BURSTT, CHORD, DSA, and SKA, in harmony with other probes, will map the baryon content of the full extent of the cosmic web.
Editorial analysis
A structured set of objections, weighed in public.
Referee Report
Summary. The paper measures cross-correlations between dispersion measures (DMs) from 3,455 CHIME/FRB sources at z ≲ 1.5 and ten tracers of large-scale structure and baryons (galaxies, weak lensing, CIB, CMB lensing, tSZ, X-ray clusters/superclusters, SXRB, radio continuum), reporting detections at 2.6–5σ. It compares the amplitudes of the tSZ×DM and SXRB×DM correlations to predictions from a baryon-distribution model inferred from the DM–z relation, finding consistency with moderate feedback at ~0.5σ and ruling out a weaker-feedback scenario at ~3.5σ via the SXRB×DM measurement.
Significance. If the central claims hold after addressing modeling independence, the work supplies a multi-tracer empirical foundation for using FRBs to map baryons across the cosmic web, with hot-gas tracers providing direct leverage on feedback. The reported significances and the quantitative feedback test would constitute a useful addition to the baryon-census literature once the DM–z model construction is shown to be independent of the correlation data.
major comments (2)
- [Abstract; results and modeling sections describing the DM–z-inferred predictions] The ~3.5σ exclusion of the weak-feedback model (abstract) rests on comparing observed SXRB×DM and tSZ×DM amplitudes to predictions from a baryon-distribution model inferred from the DM–z relation. Because the DM–z relation is itself measured from FRB data, it is essential to demonstrate that the model construction uses neither the same 3,455 sightlines nor the same LSS tracers that enter the correlation measurements; otherwise the tension is at least partially circular and the quoted significance cannot be interpreted at face value.
- [Data and methods sections on sample selection, covariance, and DM decomposition] The reported 2.6–5σ significances and the feedback constraint depend on the precise data-selection cuts, redshift weighting, covariance estimation, and subtraction of host-galaxy DM contributions. These steps are not visible in sufficient detail to assess whether residual host or local contributions could mimic the reported IGM-driven correlations.
minor comments (2)
- [Abstract] The abstract lists ten probes but does not explicitly state the effective number of independent sightlines after masking or the median redshift of the sample; adding these numbers would improve readability.
- [Results section] Notation for the various cross-correlation estimators (e.g., tSZ×DM) should be defined once in the text before first use in the results.
Simulated Author's Rebuttal
We thank the referee for their careful reading of the manuscript and for the constructive comments, which have helped us improve the clarity and robustness of our presentation. We address each major comment in turn below.
read point-by-point responses
-
Referee: [Abstract; results and modeling sections describing the DM–z-inferred predictions] The ~3.5σ exclusion of the weak-feedback model (abstract) rests on comparing observed SXRB×DM and tSZ×DM amplitudes to predictions from a baryon-distribution model inferred from the DM–z relation. Because the DM–z relation is itself measured from FRB data, it is essential to demonstrate that the model construction uses neither the same 3,455 sightlines nor the same LSS tracers that enter the correlation measurements; otherwise the tension is at least partially circular and the quoted significance cannot be interpreted at face value.
Authors: The DM–z relation is obtained from the redshift-binned mean DM of the full FRB sample and is used solely to calibrate the overall baryon fraction and its redshift evolution in a halo-model framework. The spatial distribution of baryons (including feedback strength) is then taken from simulation-calibrated prescriptions that are not fit to any angular correlation data. Consequently, the model predictions for the tSZ×DM and SXRB×DM amplitudes contain no information from the measured cross-correlations with the ten LSS tracers; those measurements are used only for the subsequent comparison. While the same 3,455 sightlines contribute to both the mean DM(z) and the correlations, the former constrains only the line-of-sight integral while the latter probes transverse clustering, rendering the test non-circular. To make this separation explicit for readers, we will insert a short clarifying subsection in the modeling section that states the inputs to the baryon-distribution model and confirms that no correlation statistics entered its construction. revision: yes
-
Referee: [Data and methods sections on sample selection, covariance, and DM decomposition] The reported 2.6–5σ significances and the feedback constraint depend on the precise data-selection cuts, redshift weighting, covariance estimation, and subtraction of host-galaxy DM contributions. These steps are not visible in sufficient detail to assess whether residual host or local contributions could mimic the reported IGM-driven correlations.
Authors: We agree that the current level of detail is insufficient for full reproducibility and for an independent assessment of possible residual host or local DM contributions. In the revised manuscript we will expand the relevant sections to provide: (i) the exact numerical cuts applied to the FRB catalog together with their motivation, (ii) the redshift-weighting function used for each cross-correlation, (iii) the complete covariance estimation procedure (including the number of jackknife or bootstrap realizations and any regularization), and (iv) the explicit functional form and parameter values adopted for the host-galaxy DM subtraction, including any redshift-dependent priors. These additions will allow readers to verify that the reported signals are driven by the IGM component. revision: yes
Circularity Check
DM-z relation-inferred baryon model used to 'predict' tSZ×DM and SXRB×DM amplitudes shares the same FRB sample as the measured correlations
specific steps
-
fitted input called prediction
[Abstract]
"The measured amplitude of tSZ×DM and SXRB×DM correlations are consistent with theoretical predictions of baryon distribution from a DM-z relation-inferred model with moderate feedback at ∼0.5σ level. Weaker feedback scenario is ruled out at ∼3.5σ by the SXRB×DM correlation."
The DM-z relation is obtained by fitting the same 3,455 FRB dispersion measures that are cross-correlated with tSZ and SXRB maps. The baryon model is then built from this fitted relation and used to generate predicted correlation amplitudes; the comparison therefore tests the data against a model whose parameters were tuned to the very same DM sample, rendering the quoted σ-level statements partially circular.
full rationale
The central validation claim compares measured cross-correlation amplitudes to theoretical predictions derived from a baryon-distribution model that is itself inferred from the DM-z relation. Because the DM-z relation is constructed from the identical CHIME/FRB sightlines whose DM values enter the correlation measurements, the model parameters are fitted to the data being tested. This reduces the 'prediction' to a consistency check against a fitted input rather than an independent forecast, producing partial circularity in the feedback-strength conclusions.
Axiom & Free-Parameter Ledger
free parameters (1)
- feedback strength
axioms (2)
- domain assumption Standard flat Lambda-CDM cosmology and linear bias for large-scale structure tracers
- domain assumption Host-galaxy DM contribution can be statistically subtracted without biasing the IGM signal
Reference graph
Works this paper leans on
-
[1]
doi:10.1093/mnras/stv1062 , eprint =
Aird, J., Coil, A. L., Georgakakis, A., et al. 2015, MNRAS, 451, 1892, doi: 10.1093/mnras/stv1062
-
[2]
Anbajagane, D., Pandey, S., & Chang, C. 2024, The Open Journal of Astrophysics, 7, 108, doi: 10.33232/001c.126788 22Sharma et al
-
[3]
2025a, The Open Journal of Astrophysics, 8, 46161, doi: 10.33232/001c.146161
Anbajagane, D., Chang, C., Drlica-Wagner, A., et al. 2025a, The Open Journal of Astrophysics, 8, 46161, doi: 10.33232/001c.146161
-
[4]
2025b, The Open Journal of Astrophysics, 8, 46159, doi: 10.33232/001c.146159
Anbajagane, D., Alarcon, A., Teixeira, R., et al. 2025b, The Open Journal of Astrophysics, 8, 46159, doi: 10.33232/001c.146159
-
[5]
2025c, The Open Journal of Astrophysics, 8, 46158, doi: 10.33232/001c.146158
Anbajagane, D., Zhang, Z., Chang, C., et al. 2025c, The Open Journal of Astrophysics, 8, 46158, doi: 10.33232/001c.146158
-
[6]
2025d, The Open Journal of Astrophysics, 8, 46160, doi: 10.33232/001c.146160
Anbajagane, D., Chang, C., Chicoine, N., et al. 2025d, The Open Journal of Astrophysics, 8, 46160, doi: 10.33232/001c.146160
-
[7]
The Open Journal of Astrophysics , author =
Asgari, M., Mead, A. J., & Heymans, C. 2023, The Open Journal of Astrophysics, 6, 39, doi: 10.21105/astro.2303.08752
-
[8]
Baptista, J., Prochaska, J. X., Mannings, A. G., et al. 2024, ApJ, 965, 57, doi: 10.3847/1538-4357/ad2705
-
[9]
Behroozi, P., Wechsler, R. H., Hearin, A. P., & Conroy, C. 2019, MNRAS, 488, 3143, doi: 10.1093/mnras/stz1182
-
[10]
, year = 2002, month = aug, volume =
Berlind, A. A., & Weinberg, D. H. 2002, ApJ, 575, 587, doi: 10.1086/341469
-
[11]
Bernales-Cortes, L., Tejos, N., Prochaska, J. X., et al. 2025, A&A, 696, A81, doi: 10.1051/0004-6361/202452026
-
[12]
doi:10.1093/mnras/stae2100 , archiveprefix =
Bigwood, L., Amon, A., Schneider, A., et al. 2024, MNRAS, 534, 655, doi: 10.1093/mnras/stae2100
-
[13]
Bilicki, M., Peacock, J. A., Jarrett, T. H., et al. 2016, ApJS, 225, 5, doi: 10.3847/0067-0049/225/1/5
-
[14]
Bock, J. J., Aboobaker, A. M., Adamo, J., et al. 2026, ApJ, 999, 139, doi: 10.3847/1538-4357/ae2be2
-
[15]
Boller, T., Freyberg, M. J., Tr¨ umper, J., et al. 2016, A&A, 588, A103, doi: 10.1051/0004-6361/201525648
-
[16]
2025, A&A, 695, A163, doi: 10.1051/0004-6361/202453223
Bollo, V., P´ eroux, C., Zwaan, M., et al. 2025, A&A, 695, A163, doi: 10.1051/0004-6361/202453223
-
[17]
2018, in Society of Photo-Optical Instrumentation Engineers (SPIE) Conference Series, Vol
Bryan, S., Austermann, J., Ferrusca, D., et al. 2018, in Society of Photo-Optical Instrumentation Engineers (SPIE) Conference Series, Vol. 10708, Millimeter, Submillimeter, and Far-Infrared Detectors and Instrumentation for Astronomy IX, ed. J. Zmuidzinas & J.-R. Gao, 107080J, doi: 10.1117/12.2314130
-
[18]
Bulbul, E., Liu, A., Kluge, M., et al. 2024, A&A, 685, A106, doi: 10.1051/0004-6361/202348264
-
[19]
Carilli, C. L., & Rawlings, S. 2004, NewAR, 48, 979, doi: 10.1016/j.newar.2004.09.001 CCAT-Prime Collaboration, Aravena, M., Austermann, J. E., et al. 2023, ApJS, 264, 7, doi: 10.3847/1538-4365/ac9838
-
[20]
2009, ApJ, 695, 292, doi: 10.1088/0004-637X/695/1/292
Ceverino, D., & Klypin, A. 2009, ApJ, 695, 292, doi: 10.1088/0004-637X/695/1/292
-
[21]
Chaussidon, E., Hotinli, S. C., Ferraro, S., et al. 2026, arXiv e-prints, arXiv:2604.04867, doi: 10.48550/arXiv.2604.04867
work page internal anchor Pith review Pith/arXiv arXiv doi:10.48550/arxiv.2604.04867 2026
-
[22]
Cheng, A. Q., Andrew, S. E., Wang, H., & Masui, K. W. 2026, ApJ, 998, 252, doi: 10.3847/1538-4357/ae369f
-
[23]
2023, ApJ, 958, 118, doi: 10.3847/1538-4357/acf4a1
Chiang, Y.-K. 2023, ApJ, 958, 118, doi: 10.3847/1538-4357/acf4a1
-
[24]
2025, ApJ, 992, 65, doi: 10.3847/1538-4357/adfb6a
Chiang, Y.-K., Makiya, R., & M´ enard, B. 2025, ApJ, 992, 65, doi: 10.3847/1538-4357/adfb6a
-
[25]
2020, ApJ, 902, 56, doi: 10.3847/1538-4357/abb403 CHIME/FRB Collaboration, Abbott, T., Andersen, B
Chiang, Y.-K., Makiya, R., M´ enard, B., & Komatsu, E. 2020, ApJ, 902, 56, doi: 10.3847/1538-4357/abb403 CHIME/FRB Collaboration, Abbott, T., Andersen, B. C., et al. 2026, ApJS, 283, 34, doi: 10.3847/1538-4365/ae3828
-
[26]
Modelling baryonic feedback for survey cosmology
Chisari, N. E., Mead, A. J., Joudaki, S., et al. 2019, The Open Journal of Astrophysics, 2, 4, doi: 10.21105/astro.1905.06082
-
[27]
2019, MNRAS, 487, 5753, doi: 10.1093/mnras/stz1666
Connor, L. 2019, MNRAS, 487, 5753, doi: 10.1093/mnras/stz1666
-
[28]
arXiv , author =:2302.14788 , journal =
Connor, L., Ravi, V., Catha, M., et al. 2023, ApJL, 949, L26, doi: 10.3847/2041-8213/acd3ea
-
[29]
2025, Nature Astronomy, 9, 1226, doi: 10.1038/s41550-025-02566-y
Connor, L., Ravi, V., Sharma, K., et al. 2025, Nature Astronomy, 9, 1226, doi: 10.1038/s41550-025-02566-y
-
[30]
NE2001.I. A New Model for the Galactic Distribution of Free Electrons and its Fluctuations
Cordes, J. M., & Lazio, T. J. W. 2002, arXiv e-prints, astro, doi: 10.48550/arXiv.astro-ph/0207156
work page Pith review doi:10.48550/arxiv.astro-ph/0207156 2002
-
[31]
Cordes, J. M., & Lazio, T. J. W. 2003, arXiv e-prints, astro, doi: 10.48550/arXiv.astro-ph/0301598
work page internal anchor Pith review doi:10.48550/arxiv.astro-ph/0301598 2003
-
[32]
2025, arXiv e-prints, arXiv:2507.04476, doi: 10.48550/arXiv.2507.04476 DES Collaboration, Abbott, T
Dalal, N., To, C.-H., Hirata, C., et al. 2025, arXiv e-prints, arXiv:2507.04476, doi: 10.48550/arXiv.2507.04476 DES Collaboration, Abbott, T. M. C., Aguena, M., et al. 2026, arXiv e-prints, arXiv:2602.10065, doi: 10.48550/arXiv.2602.10065
-
[33]
Miscentring of optical galaxy clusters based on Sunyaev–Zeldovich counterparts
Ding, J., Dalal, R., Sunayama, T., et al. 2025, MNRAS, 536, 572, doi: 10.1093/mnras/stae2601
-
[34]
2025, MNRAS, 540, 1055, doi: 10.1093/mnras/staf709
Efstathiou, G., & McCarthy, F. 2025, MNRAS, 540, 1055, doi: 10.1093/mnras/staf709
-
[35]
Fabian, A. C. 2012, ARA&A, 50, 455, doi: 10.1146/annurev-astro-081811-125521
work page Pith review doi:10.1146/annurev-astro-081811-125521 2012
-
[36]
Ferreira, T., Alonso, D., Garcia-Garcia, C., & Chisari, N. E. 2024, PhRvL, 133, 051001, doi: 10.1103/PhysRevLett.133.051001
-
[37]
2024, ApJS, 271, 49, doi: 10.3847/1538-4365/ad27d6
Fonseca, E., Pleunis, Z., Breitman, D., et al. 2024, ApJS, 271, 49, doi: 10.3847/1538-4365/ad27d6
-
[38]
Fukugita, M., & Peebles, P. J. E. 2004, ApJ, 616, 643, doi: 10.1086/425155
-
[39]
The Simons Observatory: Design, Integration, and Testing of the Small Aperture Telescopes
Galitzki, N., Tsan, T., Spisak, J., et al. 2024, ApJS, 274, 33, doi: 10.3847/1538-4365/ad64c9
-
[40]
Gatti, M., Anbajagane, D., Chang, C., et al. 2025, arXiv e-prints, arXiv:2509.03798, doi: 10.48550/arXiv.2509.03798 Anthology of F ast Radio Burst Dispersion Measure Cross-Correlations23
-
[41]
Giri, S. K., & Schneider, A. 2021, JCAP, 2021, 046, doi: 10.1088/1475-7516/2021/12/046
-
[42]
C., Fong, W.-f., Kilpatrick, C
Gordon, A. C., Fong, W.-f., Kilpatrick, C. D., et al. 2023, ApJ, 954, 80, doi: 10.3847/1538-4357/ace5aa
-
[43]
2025a, PhRvD, 112, 123507, doi: 10.1103/mdhz-fgj8
Zhou, R. 2025a, PhRvD, 112, 123507, doi: 10.1103/mdhz-fgj8
-
[44]
2025b, PhRvD, 111, 023534, doi: 10.1103/PhysRevD.111.023534
Hadzhiyska, B., Ferraro, S., & Zhou, R. 2025b, PhRvD, 111, 023534, doi: 10.1103/PhysRevD.111.023534
-
[45]
2025c, PhRvD, 112, 103532, doi: 10.1103/xjst-ffw2
Hadzhiyska, B., Sailer, N., & Ferraro, S. 2025c, PhRvD, 112, 103532, doi: 10.1103/xjst-ffw2
-
[46]
doi:10.1103/kclp-x5j1 , archiveprefix =
Hadzhiyska, B., Ferraro, S., Ried Guachalla, B., et al. 2025d, PhRvD, 112, 083509, doi: 10.1103/kclp-x5j1
-
[47]
Hale, C. L., Schwarz, D. J., Best, P. N., et al. 2024, MNRAS, 527, 6540, doi: 10.1093/mnras/stad3088
-
[48]
The DSA-2000 -- A Radio Survey Camera
Hallinan, G., Ravi, V., Weinreb, S., et al. 2019, in Bulletin of the American Astronomical Society, Vol. 51, 255, doi: 10.48550/arXiv.1907.07648
work page internal anchor Pith review doi:10.48550/arxiv.1907.07648 2019
-
[49]
Astronomy & Astrophysics , author =
Hartlap, J., Simon, P., & Schneider, P. 2007, A&A, 464, 399, doi: 10.1051/0004-6361:20066170
-
[50]
Hotinli, S. C., Smith, K. M., & Ferraro, S. 2025, arXiv e-prints, arXiv:2506.21657, doi: 10.48550/arXiv.2506.21657
-
[51]
Hussaini, M., Connor, L., Konietzka, R. M., et al. 2025, ApJL, 993, L27, doi: 10.3847/2041-8213/ae0a49 Ivezi´ c,ˇZ., Kahn, S. M., Tyson, J. A., et al. 2019, ApJ, 873, 111, doi: 10.3847/1538-4357/ab042c
-
[52]
James, C. W., Prochaska, J. X., Macquart, J. P., et al. 2022a, MNRAS, 509, 4775, doi: 10.1093/mnras/stab3051
-
[53]
James, C. W., Ghosh, E. M., Prochaska, J. X., et al. 2022b, MNRAS, 516, 4862, doi: 10.1093/mnras/stac2524
-
[54]
2015, TreeCorr: Two-point correlation functions, Astrophysics Source Code Library, record ascl:1508.007
Jarvis, M. 2015, TreeCorr: Two-point correlation functions, Astrophysics Source Code Library, record ascl:1508.007. http://ascl.net/1508.007
2015
-
[55]
S., Sorini, D., Lee, K.-G., & Dav´ e, R
Khrykin, I. S., Sorini, D., Lee, K.-G., & Dav´ e, R. 2024, MNRAS, 529, 537, doi: 10.1093/mnras/stae525
-
[56]
J., Bocquet S., Singh A., 2024, yCat,
Singh, A. 2023, MNRAS, 526, 3757, doi: 10.1093/mnras/stad2729
-
[57]
Konietzka, R. M., Connor, L., Semenov, V. A., et al. 2025, arXiv e-prints, arXiv:2507.07090, doi: 10.48550/arXiv.2507.07090 La Posta, A., Alonso, D., Chisari, N. E., Ferreira, T., & Garc´ ıa-Garc´ ıa, C. 2024, arXiv e-prints, arXiv:2412.12081, doi: 10.48550/arXiv.2412.12081 —. 2025, PhRvD, 112, 043525, doi: 10.1103/m77z-w7pl
-
[58]
T., Bogd´ an,´A., Chadayammuri, U., et al
Lau, E. T., Bogd´ an,´A., Chadayammuri, U., et al. 2023, MNRAS, 518, 1496, doi: 10.1093/mnras/stac3147
-
[59]
Euclid Definition Study Report
Laureijs, R., Amiaux, J., Arduini, S., et al. 2011, arXiv e-prints, arXiv:1110.3193, doi: 10.48550/arXiv.1110.3193
work page internal anchor Pith review doi:10.48550/arxiv.1110.3193 2011
-
[60]
Leung, C., Borrow, J., Masui, K. W., et al. 2025a, arXiv e-prints, arXiv:2509.19514, doi: 10.48550/arXiv.2509.19514
-
[61]
2025, ApJL, 991, L25, doi: 10.3847/2041-8213/ae044d
Leung, C., Simha, S., Medlock, I., et al. 2025b, ApJL, 991, L25, doi: 10.3847/2041-8213/ae044d
-
[62]
2022, PASP, 134, 094106, doi: 10.1088/1538-3873/ac8f71
Lin, H.-H., Lin, K.-y., Li, C.-T., et al. 2022, PASP, 134, 094106, doi: 10.1088/1538-3873/ac8f71
-
[63]
2024, A&A, 683, A130, doi: 10.1051/0004-6361/202348884
Liu, A., Bulbul, E., Kluge, M., et al. 2024, A&A, 683, A130, doi: 10.1051/0004-6361/202348884
-
[64]
H., Ferraro, S., Schaan, E., et al
Liu, R. H., Ferraro, S., Schaan, E., et al. 2025, PhRvD, 112, 083561, doi: 10.1103/jqn8-19gx
-
[65]
Macquart, J. P., Prochaska, J. X., McQuinn, M., et al. 2020, Nature, 581, 391, doi: 10.1038/s41586-020-2300-2
-
[66]
Sievers, J. L. 2019, PhRvD, 100, 103532, doi: 10.1103/PhysRevD.100.103532
-
[67]
Marocco, F., Eisenhardt, P. R. M., Fowler, J. W., et al. 2021, ApJS, 253, 8, doi: 10.3847/1538-4365/abd805
-
[68]
McCarty, S., Connor, L., & Konietzka, R. M. 2026, arXiv e-prints, arXiv:2602.16781, doi: 10.48550/arXiv.2602.16781
-
[69]
2026, arXiv e-prints, arXiv:2602.02484, doi: 10.48550/arXiv.2602.02484
McDonald, W., Schaye, J., Kuijken, K., et al. 2026, arXiv e-prints, arXiv:2602.02484, doi: 10.48550/arXiv.2602.02484
-
[70]
2013, The Astrophysical Journal Letters, 780, L33, doi: 10.1088/2041-8205/780/2/L33
McQuinn, M. 2014, ApJL, 780, L33, doi: 10.1088/2041-8205/780/2/L33
-
[71]
Medlock, I., Nagai, D., Angl´ es-Alc´ azar, D., & Gebhardt, M. 2025, ApJ, 983, 46, doi: 10.3847/1538-4357/adbc9c M´ enard, B., Scranton, R., Fukugita, M., & Richards, G. 2010, MNRAS, 405, 1025, doi: 10.1111/j.1365-2966.2010.16486.x
-
[72]
Mernier, F., Biffi, V., Yamaguchi, H., et al. 2018, SSRv, 214, 129, doi: 10.1007/s11214-018-0565-7
-
[73]
Moster, B. P., Naab, T., & White, S. D. M. 2013, MNRAS, 428, 3121, doi: 10.1093/mnras/sts261 M¨ unchmeyer, M., Madhavacheril, M. S., Ferraro, S.,
-
[74]
Johnson, M. C., & Smith, K. M. 2019, PhRvD, 100, 083508, doi: 10.1103/PhysRevD.100.083508
-
[75]
J., Alonso, D., Bilicki, M., et al
Nakoneczny, S. J., Alonso, D., Bilicki, M., et al. 2024, A&A, 681, A105, doi: 10.1051/0004-6361/202347728
-
[76]
Hummels, C. B. 2024, ApJL, 972, L26, doi: 10.3847/2041-8213/ad725b
-
[77]
2023, MNRAS, 519, 2069, doi: 10.1093/mnras/stac3669
Osato, K., & Nagai, D. 2023, MNRAS, 519, 2069, doi: 10.1093/mnras/stac3669
-
[78]
2024, MNRAS, 528, 5008, doi: 10.1093/mnras/stae342
Otsuki, M., & Hirashita, H. 2024, MNRAS, 528, 5008, doi: 10.1093/mnras/stae342
-
[79]
Pandey, S., Hill, J. C., Alarcon, A., et al. 2025, arXiv e-prints, arXiv:2506.07432, doi: 10.48550/arXiv.2506.07432 24Sharma et al
-
[80]
Patil, S. S., Main, R. A., Fonseca, E., et al. 2026, ApJL, 997, L5, doi: 10.3847/2041-8213/ae2eb3 P´ eroux, C., & Howk, J. C. 2020, ARA&A, 58, 363, doi: 10.1146/annurev-astro-021820-120014
discussion (0)
Sign in with ORCID, Apple, or X to comment. Anyone can read and Pith papers without signing in.