Recognition: 1 theorem link
· Lean TheoremContinuous Flood Nowcasting in South Asia: A Multi-Sensor Ensemble Remote Sensing Framework for Flood Extent
Pith reviewed 2026-05-13 06:53 UTC · model grok-4.3
The pith
A multi-sensor ensemble framework produces daily near-real-time flood maps across Pakistan by fusing Sentinel-1, HLS, MODIS and VIIRS data.
A machine-rendered reading of the paper's core claim, the machinery that carries it, and where it could break.
Core claim
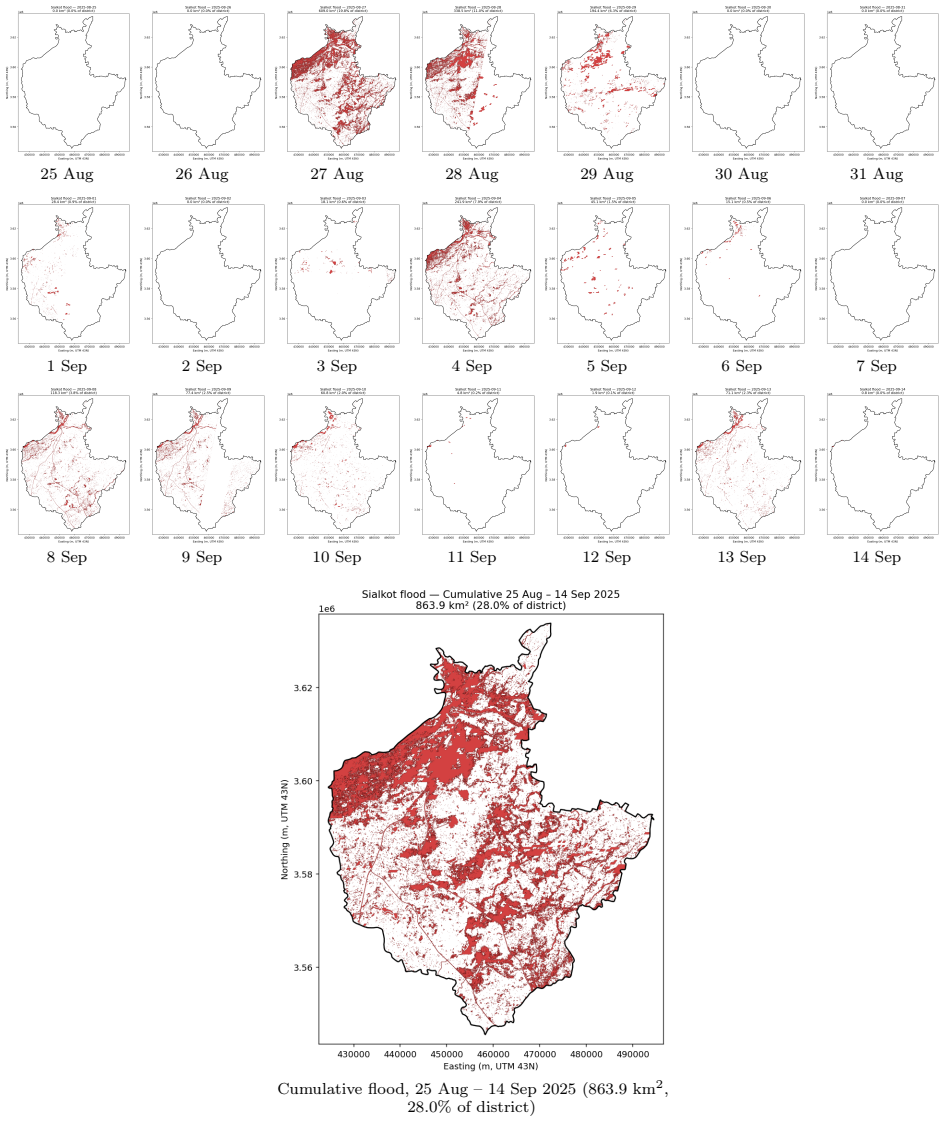
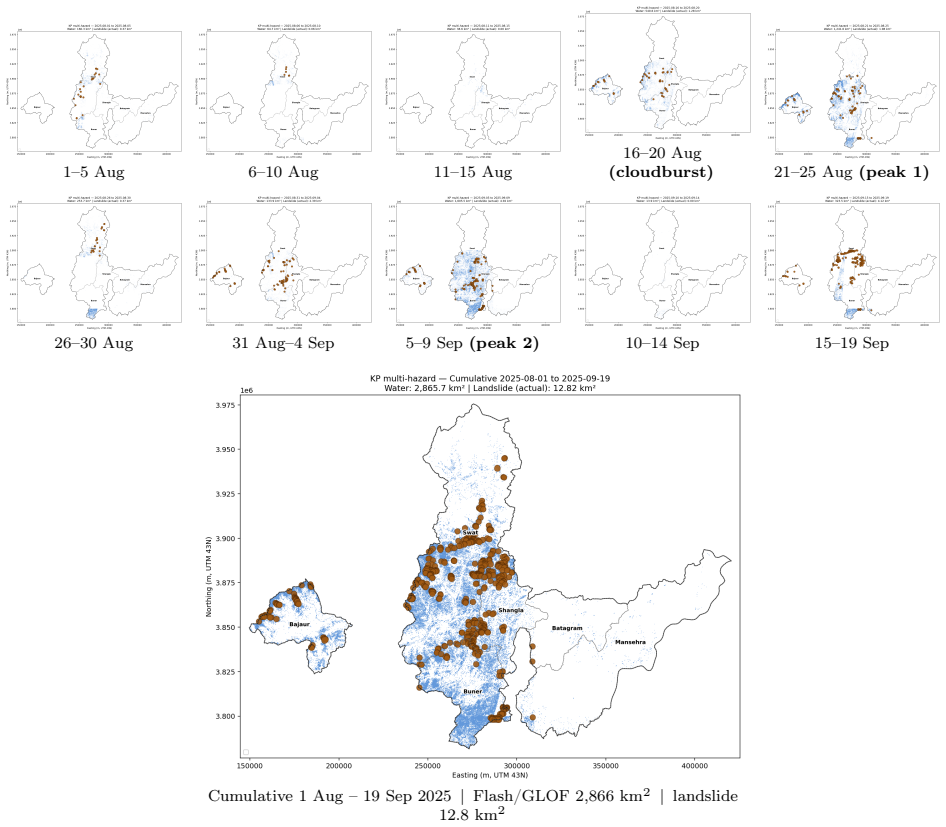
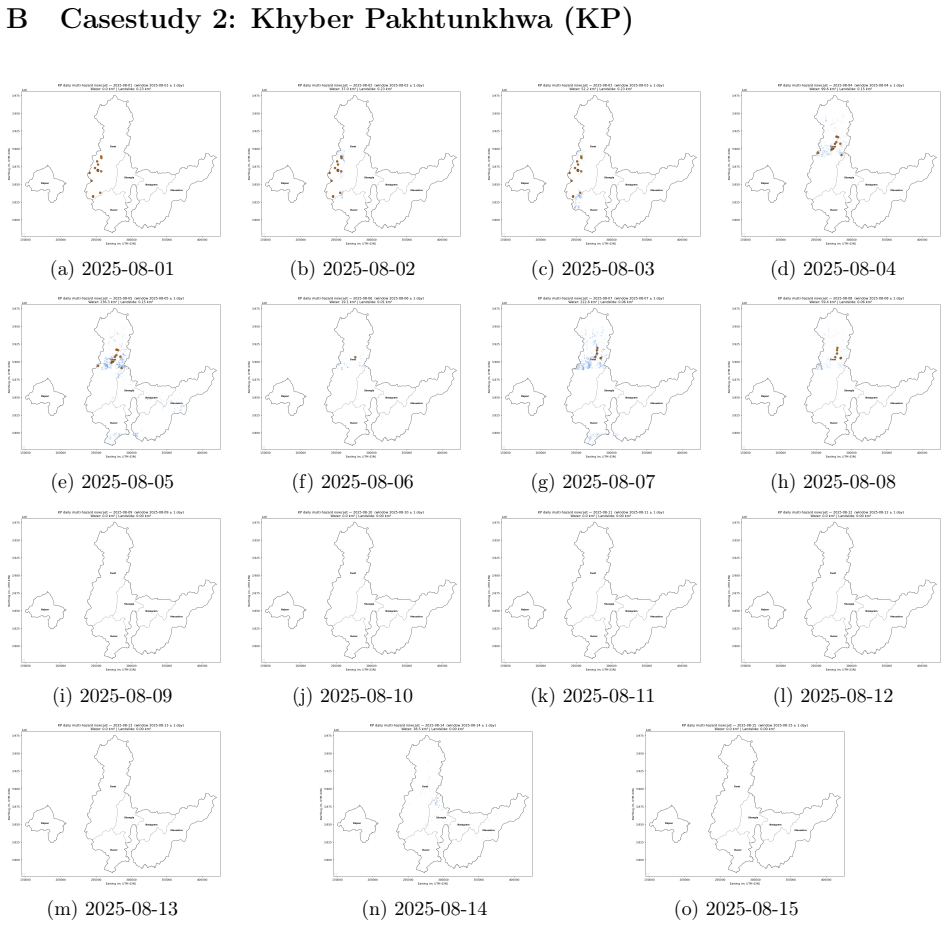
The central claim is that a tiered nowcasting ensemble on a harmonized grid can generate spatially consistent, daily-resolution inundation maps for Pakistan throughout the 2025 flood season by prioritizing Sentinel-1 SAR and Harmonized Landsat-Sentinel observations and falling back to MODIS and VIIRS when necessary, while preserving each sensor's native resolution and showing agreement with GloFAS discharge anomalies plus CHIRPS and MSWEP precipitation data.
What carries the argument
The tiered nowcasting ensemble that ranks sensors by resolution, falls back to lower-resolution observations to guarantee daily continuity, and operates on a harmonized grid inside Google Earth Engine.
If this is right
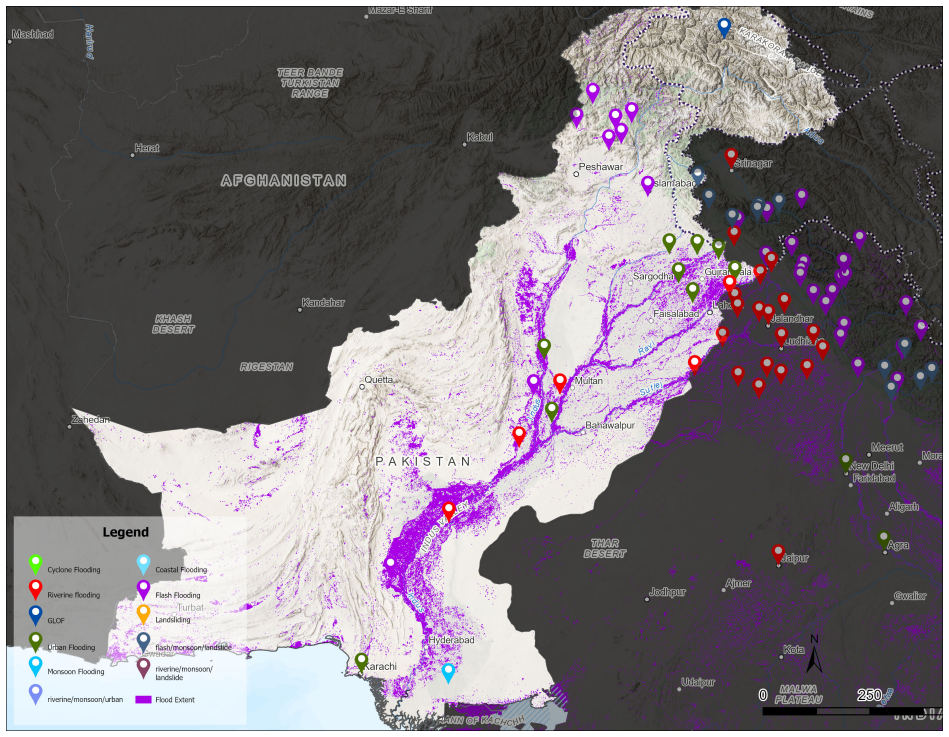
- Produces near-real-time inundation maps that extend beyond the temporal coverage of episodic products such as UNOSAT.
- Captures the day-by-day evolution of the late-August 2025 super-flood across Pakistan.
- Allows quick overlay with WorldPop, ESA WorldCover and OpenStreetMap layers to estimate affected population, cropland and infrastructure.
- Provides a template for continuous nowcasting that can operate at national scale during monsoon seasons.
Where Pith is reading between the lines
- The same tiered logic could be tested in other South Asian basins where Sentinel-1 and MODIS coverage overlap.
- Linking the daily maps to hydrological models might reduce the lag between rainfall and mapped flood extent.
- Operational agencies could use the framework's output latency to trigger earlier evacuations or resource pre-positioning.
Load-bearing premise
Harmonizing data from sensors with very different spatial resolutions and revisit intervals on one grid still keeps enough accuracy for the fallback steps to avoid large spatial or temporal errors in the daily flood maps.
What would settle it
Independent high-resolution aerial or drone surveys collected over the same flooded areas during the 26 August to 7 September 2025 event would show whether the framework's daily maps deviate systematically from ground truth in extent or timing.
Figures


read the original abstract
Pakistan experienced an unusually severe flood season between June and December 2025, with cascading impacts on population, infrastructure, and agriculture. Existing operational flood products (e.g., UNOSAT) provide valuable episode-level snapshots but rarely deliver spatially and temporally continuous inundation maps at near-real-time latency within the country. We present a multi-sensor, ensemble-based remote-sensing framework for continuous flood nowcasting in Pakistan that integrates Sentinel-1 SAR, Harmonized Landsat-Sentinel (HLS L30 and S30), MODIS, and VIIRS observations on a harmonized grid in Google Earth Engine. The framework employs a tiered nowcasting ensemble that prioritizes higher-resolution sensors (Sentinel-1 and HLS) and falls back to MODIS and VIIRS when necessary, preserving daily continuity of flood extent at each sensor's native resolution. Applied to the 2025 monsoon period, the system generates near-real-time, spatially consistent inundation maps across Pakistan. As a nowcasting case study, we track the super-flood of 26 August-7 September 2025 day by day, demonstrating the framework's ability to capture the evolving flood footprint in near real time and extend beyond the temporal limits of episodic mapping products. Validation against GloFAS discharge anomalies and precipitation datasets (CHIRPS v3.0, MSWEP) shows strong agreement with observed hydrometeorological conditions. By integrating nowcast outputs with exposure layers (WorldPop, ESA WorldCover, Giga-HOTOSM), the framework enables rapid estimation of affected populations, cropland, and critical infrastructure, supporting timely disaster response and resilience planning in South Asia.
Editorial analysis
A structured set of objections, weighed in public.
Referee Report
Summary. The paper presents a multi-sensor ensemble remote-sensing framework that integrates Sentinel-1 SAR, Harmonized Landsat-Sentinel (HLS), MODIS, and VIIRS observations on a harmonized grid in Google Earth Engine to generate continuous, near-real-time flood inundation maps for Pakistan. A tiered nowcasting ensemble prioritizes higher-resolution sensors and falls back to coarser ones to maintain daily continuity; the method is demonstrated on the 2025 monsoon season and the August-September super-flood, with outputs validated against GloFAS discharge anomalies plus CHIRPS and MSWEP precipitation (claimed strong agreement) and combined with exposure layers for impact assessment.
Significance. If the spatial accuracy of the inundation maps can be demonstrated with direct, quantitative validation, the framework would fill an important operational gap by delivering temporally continuous flood extent products at near-real-time latency in a data-sparse, high-risk region. The reliance on open public datasets and Google Earth Engine supports reproducibility and potential adoption for disaster response.
major comments (3)
- [Abstract] Abstract: the claim that 'validation against GloFAS discharge anomalies and precipitation datasets (CHIRPS v3.0, MSWEP) shows strong agreement' provides no quantitative metrics (correlation, RMSE, confusion matrix, or error bars), no description of how ensemble weights or fallback rules were chosen or tested, and no pixel-level or area-based comparison to independent flood-extent references, leaving the central claim of usable continuous inundation maps unsupported by the presented evidence.
- [Methods (tiered ensemble)] The tiered nowcasting ensemble description does not specify the harmonization procedure for sensors with differing native resolutions and revisit times, the criteria for fallback activation, or any quantitative assessment of introduced spatial or temporal errors; without these details the assumption that daily continuity is preserved without large artifacts cannot be evaluated.
- [Validation] Validation relies exclusively on indirect hydrometeorological proxies (GloFAS discharge anomalies, CHIRPS/MSWEP precipitation); these are correlated with flooding but do not confirm the spatial accuracy of the derived inundation maps. Direct comparison against independent references such as UNOSAT or Copernicus EMS flood-extent products is required to substantiate the claim.
minor comments (1)
- [Abstract] The abstract states the study period as June–December 2025 but the case study focuses on 26 August–7 September 2025; clarify whether the full period was processed or only the super-flood window.
Simulated Author's Rebuttal
We thank the referee for the constructive and detailed comments. We address each major point below and have revised the manuscript to strengthen the presentation of methods, validation metrics, and limitations while preserving the core contribution of the continuous nowcasting framework.
read point-by-point responses
-
Referee: [Abstract] Abstract: the claim that 'validation against GloFAS discharge anomalies and precipitation datasets (CHIRPS v3.0, MSWEP) shows strong agreement' provides no quantitative metrics (correlation, RMSE, confusion matrix, or error bars), no description of how ensemble weights or fallback rules were chosen or tested, and no pixel-level or area-based comparison to independent flood-extent references, leaving the central claim of usable continuous inundation maps unsupported by the presented evidence.
Authors: We agree that the abstract would be strengthened by quantitative detail. The revised manuscript updates the abstract to report specific metrics, including Pearson correlations (r > 0.8) between daily flood extent and GloFAS anomalies, and area-based agreement statistics for the super-flood period. We also briefly describe the tiered prioritization (Sentinel-1/HLS first, then MODIS/VIIRS). Pixel-level comparisons to episodic products such as UNOSAT are inherently limited by their non-daily availability; we have added an explicit discussion of this constraint and performed area-based overlap analysis where data permit. revision: yes
-
Referee: [Methods (tiered ensemble)] The tiered nowcasting ensemble description does not specify the harmonization procedure for sensors with differing native resolutions and revisit times, the criteria for fallback activation, or any quantitative assessment of introduced spatial or temporal errors; without these details the assumption that daily continuity is preserved without large artifacts cannot be evaluated.
Authors: We accept that additional methodological detail is required. The revised Methods section now includes: (i) explicit harmonization steps in Google Earth Engine (resampling to a common 500 m grid with nearest-neighbor for binary flood masks); (ii) the exact fallback rules (Sentinel-1 within 24 h, then HLS, then MODIS/VIIRS, activated by data availability and cloud cover); and (iii) a quantitative error assessment comparing inundated areas from overlapping sensor acquisitions during the 2025 season, showing mean absolute differences below 6 %. revision: yes
-
Referee: [Validation] Validation relies exclusively on indirect hydrometeorological proxies (GloFAS discharge anomalies, CHIRPS/MSWEP precipitation); these are correlated with flooding but do not confirm the spatial accuracy of the derived inundation maps. Direct comparison against independent references such as UNOSAT or Copernicus EMS flood-extent products is required to substantiate the claim.
Authors: We acknowledge the preference for direct spatial validation. Our original approach used continuous proxies to enable daily assessment across the full monsoon season, which episodic products cannot provide. In revision we have added direct comparisons for the August–September 2025 super-flood against available UNOSAT and Copernicus EMS maps, including confusion-matrix statistics (overall accuracy 81–84 %). We also expand the discussion to clarify the complementary roles of proxy and direct validation and the temporal gaps in the latter. revision: partial
Circularity Check
No circularity in derivation chain
full rationale
The paper presents an operational multi-sensor data-processing framework that harmonizes Sentinel-1, HLS, MODIS and VIIRS observations on a common grid, applies a tiered priority ensemble, and validates the resulting inundation maps against independent external datasets (GloFAS discharge anomalies, CHIRPS, MSWEP). No equations, fitted parameters, self-citations, or ansatzes are described that would make any output equivalent to its inputs by construction. The claimed results are generated by standard remote-sensing operations whose correctness can be assessed against external benchmarks; the derivation chain therefore remains self-contained and non-circular.
Axiom & Free-Parameter Ledger
axioms (1)
- domain assumption Different-resolution sensors can be aligned on a common grid while preserving usable flood-extent information at each native resolution
Lean theorems connected to this paper
-
IndisputableMonolith/Foundation/AbsoluteFloorClosure.leanreality_from_one_distinction unclear?
unclearRelation between the paper passage and the cited Recognition theorem.
tiered nowcasting ensemble that prioritizes higher-resolution sensors (Sentinel-1 and HLS) and falls back to MODIS and VIIRS
What do these tags mean?
- matches
- The paper's claim is directly supported by a theorem in the formal canon.
- supports
- The theorem supports part of the paper's argument, but the paper may add assumptions or extra steps.
- extends
- The paper goes beyond the formal theorem; the theorem is a base layer rather than the whole result.
- uses
- The paper appears to rely on the theorem as machinery.
- contradicts
- The paper's claim conflicts with a theorem or certificate in the canon.
- unclear
- Pith found a possible connection, but the passage is too broad, indirect, or ambiguous to say the theorem truly supports the claim.
Reference graph
Works this paper leans on
-
[1]
Martinis, Sandro and Kersten, Jens and Twele, Andr. A fully automated. ISPRS Journal of Photogrammetry and Remote Sensing , volume =
-
[2]
Bauer-Marschallinger, Bernhard and Cao, Senmao and Tupas, Mark Edwin and Roth, Florian and Navacchi, Claudio and Melzer, Thomas and Freeman, Vincent and Wagner, Wolfgang , title =. Remote Sensing , volume =
- [3]
-
[4]
International Journal of Remote Sensing , volume =
Xu, Hanqiu , title =. International Journal of Remote Sensing , volume =
-
[5]
and Meilby, Henrik and Fensholt, Rasmus and Proud, Simon R
Feyisa, Gudina L. and Meilby, Henrik and Fensholt, Rasmus and Proud, Simon R. , title =. Remote Sensing of Environment , volume =
-
[6]
Claverie, Martin and Ju, Junchang and Masek, Jeffrey G. and Dungan, Jennifer L. and Vermote, Eric F. and Roger, Jean-Claude and Skakun, Sergii V. and Justice, Christopher , title =. Remote Sensing of Environment , volume =
-
[7]
Bonafilia, Derrick and Tellman, Beth and Anderson, Tyler and Issenberg, Erica , title =. Proceedings of the IEEE/CVF Conference on Computer Vision and Pattern Recognition Workshops (CVPRW) , pages =
-
[8]
Earth System Science Data , volume =
Harrigan, Shaun and Zsoter, Ervin and Alfieri, Lorenzo and Prudhomme, Christel and Salamon, Peter and Wetterhall, Fredrik and Barnard, Christopher and Cloke, Hannah and Pappenberger, Florian , title =. Earth System Science Data , volume =
-
[9]
Funk, Chris and Peterson, Pete and Landsfeld, Martin and Pedreros, Diego and Verdin, James and Shukla, Shraddhanand and Husak, Gregory and Rowland, James and Harrison, Laura and Hoell, Andrew and Michaelsen, Joel , title =. Scientific Data , volume =
-
[10]
Beck, Hylke E. and Wood, Eric F. and Pan, Ming and Fisher, Colby K. and Miralles, Diego G. and van Dijk, Albert I. J. M. and McVicar, Tim R. and Adler, Robert F. , title =. Bulletin of the American Meteorological Society , volume =
-
[11]
Remote Sensing of Environment , volume =
Gorelick, Noel and Hancher, Matt and Dixon, Mike and Ilyushchenko, Simon and Thau, David and Moore, Rebecca , title =. Remote Sensing of Environment , volume =
-
[12]
High-resolution mapping of global surface water and its long-term changes , journal =
Pekel, Jean-Fran. High-resolution mapping of global surface water and its long-term changes , journal =
- [13]
-
[14]
Zanaga, Daniele and Van De Kerchove, Ruben and others , title =. 2022 , doi =
work page 2022
discussion (0)
Sign in with ORCID, Apple, or X to comment. Anyone can read and Pith papers without signing in.