REVIEW 4 major objections 4 minor 20 references
Vulnerabilities, Secrets and Misconfiguration in the Highest-Exposure Docker Hub Images
T0 review · 4 major / 4 minor · reviewed 2026-08-06 · deepseek-v4-flash
Pith's one-line read The most-pulled Docker Hub images almost all carry known vulnerabilities, but which ones and how many depends heavily on which scanner you use.
desk verdict Major Docker Hub measurement with reproducible artifacts; the scanner-agreement headline needs a Trivy-failure sensitivity check before the numbers are cited. read the letter →
The pith
A machine-rendered reading of the paper's core claim, the machinery that carries it, and where it could break.
The reading
What carries the argument
The exposure score E(I) = p(R_I) plus the sum of p(R_D) over downstream images D owned by I, computed on a layer inheritance forest of 84.7 million nodes and 54.4 million IS_BASE_OF edges. It linearly orders the scan queue by total ecosystem reach, so the highest-exposure repositories are scanned first. The six-scanner battery (Syft, Trivy, Grype, OSV-Scanner, Dockle, TruffleHog) covers software inventory, package vulnerabilities from three databases, CIS Docker Benchmark misconfigurations, and hardcoded secrets; findings are consolidated per image but not deduplicated across scanners, which is what makes inter-scanner agreement measurable.
What would settle it
Resolve Stage II for all 12.7 million repositories, recompute exposure scores, and check whether CVE-2026-27171 still reaches images holding 47.3% of total corpus exposure and 1.13 million distinct downstream images; if the top-52,895 set changes materially or the propagation count moves, the reported exposure-weighted figures would need revision. A cheaper check is to scan a random sample of the unresolved tail and look for rarely pulled repositories that appear as base layers of high-exposure images.
Extended reading notes
Core claim
The central claim is that vulnerability prevalence among the highest-exposure Docker Hub images is near-universal, but the reported posture is largely a property of the scanner: only a small minority of distinct vulnerabilities are confirmed by more than one database-backed scanner, while the raw secret-detection prevalence collapses to roughly 0.3% plausible credentials after hand-labeling. The paper also claims that exposure, defined as an image's own pull count plus the pull counts of every downstream image that inherits its layers, ranks the damage a flaw can do: a single zlib vulnerability reaches images carrying 47.3% of total corpus exposure and propagates to 1.13 million distinct dow
Load-bearing premise
The exposure ranking and propagation counts are computed from only the 44.05% of crawled repositories that Stage II resolved, namely the popularity head down to roughly 72 pulls, so the most-consequential-image ranking and downstream reach are lower bounds that could shift if the unresolved tail contained widely reused base layers.
Editorial extensions
If this is right
- CI and audit pipelines that trust one vulnerability scanner will miss roughly one distinct vulnerability in three; running at least two scanners backed by different databases is the direct implication.
- Registry operators can order remediation by exposure score: fixing the base image whose flaws reach the most downstream pulls targets the largest share of inherited exposure, rather than the largest number of affected images.
- Raw secret-detector hits should not gate deployments; with 99.7% of hits being non-credentials, a validation step must precede any action on them.
- Misconfigurations from the CIS Docker Benchmark are cheap to check and nearly universal, so enforcing content-trust, HEALTHCHECK, and non-root checks in CI is a practical low-cost control.
- Because exposure does not predict vulnerability, popularity is not a proxy for maintenance quality at the top of the registry.
Reading between the lines
- Inference: If scanner disagreement is as high in the broader population as in this top-exposure corpus, any single-scanner longitudinal comparison across years may be confounded by scanner changes as much as by real ecosystem change.
- Inference: Exposure-weighted CVE ranking could be turned into a live registry-level alerting signal: recompute exposure as new pulls arrive and rank newly disclosed CVEs by exposure share, giving operators an automated triage order.
- Inference: The 99.7% non-credential rate applies to raw detector hits; validating the residual ~0.3% with active credential-confirmation services could yield a small but nonzero validated-secret prevalence, which the paper leaves to future work.
- Inference: Because the propagation graph covers only the 44% of repositories Stage II resolved, the 1.13 million downstream count for a single zlib CVE is a structural lower bound; resolving the remaining 56% would most likely increase it, not decrease it.
Editorial analysis
A structured set of objections, weighed in public.
Referee Report
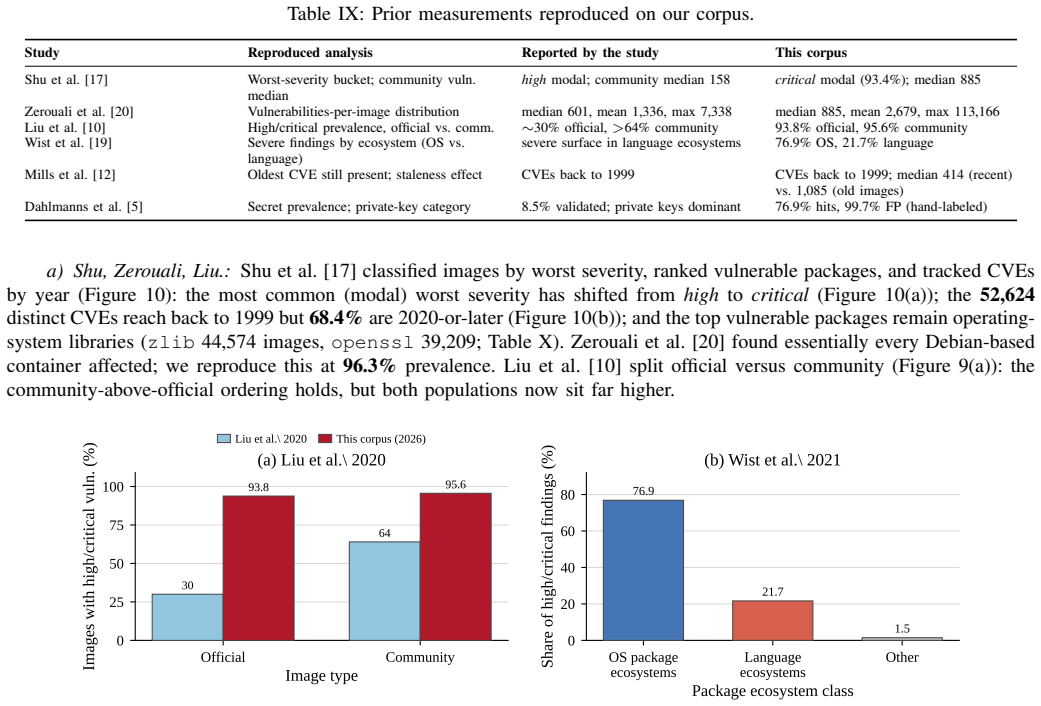
Summary. This paper presents ChimangoScan, a three-stage measurement pipeline that crawls Docker Hub, resolves 5.6M repositories into images and a layer forest (54.4M IS_BASE_OF edges), ranks images by a new exposure score E(I) that combines an image's own pulls with the pulls of its downstream subtree, and scans the 52,895 highest-exposure repositories with six open-source scanners. The central empirical claims are: (i) known vulnerabilities are near-universal (96.3% of images, 93.4% with a critical finding) and CIS misconfigurations affect 98.0%; (ii) inter-scanner agreement is very low—66.8% of 80.7M distinct (vulnerability, package) groups are flagged by only one of three vulnerability scanners and 2.7% by all three, so a single-scanner count is largely tool-dependent; (iii) TruffleHog flags secrets in 76.9% of images, but hand-labeling 1,100 detections indicates 99.7% are non-credentials; (iv) exposure-weighted CVE reach is highly concentrated, with a zlib CVE reaching 47.3% of total corpus exposure and propagating to about 1.13M downstream images; and (v) pull count/exposure do not predict vulnerability counts. The pipeline and a 283 GB dataset are released.
Significance. If the scanner-agreement and prevalence results survive the concerns below, this is a substantial empirical contribution. It is the largest multi-scanner comparison of Docker Hub images by a wide margin over prior samples, it quantifies tool-dependent measurement error in a way previous single-scanner ecosystem studies could not, and the exposure metric is a useful conceptual addition. The public release of the pipeline and dataset, the careful hand-labeling of secret detections, and the explicit lower-bound framing of propagation counts are genuine strengths. The weaknesses are localized to specific statistical and reporting decisions rather than the overall architecture, and most appear addressable by re-analysis or reframing.
major comments (4)
- [§IV-C and Table V] The agreement metrics (66.8% single-scanner, 2.7% all-three, 66.9% best single) are reported without stating how the 10,614 Trivy invocations that errored (Table V: Run OK 79.9%) are treated. If these images are included with Trivy treated as having no findings, then every (vulnerability, package) group detected by Grype or OSV-Scanner in those images automatically becomes a one-scanner group, inflating 66.8% and deflating 2.7%. Since the abstract's central claim—'the posture a single tool reports is largely an artifact of that tool'—rests directly on these percentages, the paper must report the same statistics on the complete-case subset (images where all three scanners succeeded) or explicitly state how failures were handled. This is not merely a robustness check; it changes the headline.
- [§IV-C] The agreement analysis groups findings by '(vulnerability, package)' but does not describe any canonicalization of package names or vulnerability identifiers across Trivy, Grype, and OSV-Scanner. These tools consume different databases (NVD/OSS-Index, Anchore VulnDB, OSV) and often express the same defect under different package strings (e.g., distribution package name vs. upstream name) or different advisory identifiers. Without normalization, the 66.8% 'one-scanner' share may overstate genuine disagreement because a matching defect is counted as two distinct groups. Please specify the exact grouping key, any normalization applied, and ideally a sensitivity check using CVE-only keys or an alias-matching step.
- [§IV-F] The claim that 'exposure does not predict how vulnerable an image is' is based on Spearman correlations computed on the scanned corpus, which is deliberately the top of the exposure distribution. The corpus is selected on the very variable whose predictive power is being tested; range restriction attenuates correlations and can produce near-zero estimates even when a relationship exists in the full population. The paper should either restrict the claim to 'among the highest-exposure images' or provide a selection-corrected estimate (e.g., using the lower-exposure images already resolved in Stage II but not scanned). As written, the abstract's 'exposure does not predict how vulnerable an image is' overreaches.
- [§III-B/IV-G] Only 44.05% of crawled repositories are resolved in the layer graph, down to roughly 72 pulls. While Table VIII's propagation counts are correctly framed as structural lower bounds, the exposure ranking itself—which defines the scanned 'highest-exposure' set and the exposure-weighted CVE shares in Table VII—is computed on this partial graph and is not labeled as approximate. If any omitted low-pull repositories are bases for large downstream subtrees (their descendants would be resolved, but their own top-layer image node would be absent), the queue composition and exposure shares could shift. Please add a bound or sensitivity analysis, or explicitly restate exposure-ranking claims as conditional on the resolved subgraph.
minor comments (4)
- [§III-A, Table II] 'Table II4' appears to be a formatting artifact; it should read 'Table II, fourth column' or similar.
- [§IV-D] The Wilson 95% CI for 1097/1100 non-credentials is approximately 99.1–99.8%, not 99.2–99.9% as stated; please recheck the interval.
- [§III-E] No scanner versions or vulnerability-feed dates are given. For reproducibility, list versions of Syft, Trivy, Grype, OSV-Scanner, Dockle, and TruffleHog, together with the date of the database snapshots.
- [Figure 4(a)] The Venn-like diagram's internal numbers are not all labeled by scanner subset; adding explicit subset labels would make the agreement figure easier to interpret.
Circularity Check
No significant circularity: all headline quantities are direct measurements with disclosed limitations; no derivation reduces to its inputs.
full rationale
The paper is an empirical measurement study, not a derivation chain. Its central results—96.3% vulnerability prevalence, 66.8%/2.7% scanner-divergence shares, 66.9% best-single-scanner recovery, the 99.7% TruffleHog false-positive rate, and the 1.13-million-image downstream propagation counts—are all computed from scanner outputs, the reconstructed layer graph, and hand-labeled samples; none is fitted to a target and then re-derived as a prediction. The exposure score E(I) in Eq. (1) is an explicit definition combining pull counts and downstream subtree ownership, not a parameter inferred from vulnerability counts, so the later finding that exposure does not predict vulnerability (Section IV-F, ρ≈−0.02) is an independently observable correlation rather than a tautology. The paper's stated methodological debts to Dr. Docker [16]—the cap-refining crawl and ancestry-hashed layer identifier—are credited and are not used to establish the measurement conclusions. The limitations the paper itself discloses, such as Trivy completing on only 79.9% of images (Section IV-B, Table V) and Stage II resolving 44.05% of crawled repositories so that propagation counts are structural lower bounds (Sections III-B and IV-G), are completeness/robustness concerns, not circularity: even if the Trivy failure handling affected the scanner-agreement percentages, that would be a data-quality issue, not an identity between a model output and its input. There is no load-bearing self-citation, no imported uniqueness theorem, and no ansatz smuggled in via citation; the measurement claims stand on the released dataset and pipeline rather than on an argument that reduces to its own premises.
Assumptions & free parameters
free parameters (6)
- Stage II resolution cutoff =
~72 pulls
- Scan queue cutoff =
52,895 repositories
- Single-owner attribution rule
- Metadata-only layer barring rule
- Canonical most-pulled reference rule
- TruffleHog severity rule
assumptions (5)
- domain assumption Docker Hub API returns accurate pull counts, tags, and manifests.
- domain assumption Scanner vulnerability databases are the ground truth for known CVEs.
- domain assumption Ancestry-hashed layer identifiers correctly encode layer inheritance.
- domain assumption The 1,100-detection hand-labeled sample is representative.
- domain assumption The Stage II-resolved layer graph is sufficient for exposure ranking and propagation counts.
invented entities (2)
-
Exposure score E(I)
-
Single-owner attribution
Cite this review
Pith. "Pith review of Vulnerabilities, Secrets and Misconfiguration in the Highest-Exposure Docker Hub Images." pith.science (2026). https://pith.science/paper/COTZISY7
@misc{pith2026260802669,
  author       = {Pith},
  title        = {Pith review of: Vulnerabilities, Secrets and Misconfiguration in the Highest-Exposure Docker Hub Images},
  year         = {2026},
  howpublished = {\url{https://pith.science/paper/COTZISY7}},
  note         = {Machine review of arXiv:2608.02669}
}
read the original abstract
Docker Hub is the registry underneath most container deployments, and a flaw in a widely reused base image is inherited by every image built on it. Prior ecosystem-scale measurements each rely on a single detector, leaving the tool-dependence of their counts unquantified, while the studies that do compare scanners use samples of tens to hundreds of images. We present ChimangoScan, a pipeline that crawls the Docker Hub namespace (12,716,568 repositories, 663.8 billion cumulative pulls), reconstructs the image layer graph (54.4 million IS_BASE_OF edges), ranks images by an exposure score that folds an image's own pull count and those of its entire downstream subtree into one scalar, and scans the 52,895 highest-exposure repositories (84.7% of all recorded pulls) with six independent scanners, yielding 170.4 million findings. Vulnerabilities are near-universal: 96.3% of images carry a known package vulnerability, 93.4% a critical one, and 98.0% at least one CIS Docker Benchmark misconfiguration. The posture a single tool reports is largely an artifact of that tool: of 80.7 million distinct (vulnerability, package) groups, 66.8% are flagged by only one of the three vulnerability scanners and just 2.7% by all three, and the best single scanner recovers 66.9%. TruffleHog flags a secret in 76.9% of images, yet hand-labeling 1,100 random detections finds 99.7% are non-credentials. A single zlib CVE reaches images carrying 47.3% of total corpus exposure and propagates to 1.13 million distinct downstream images, but exposure does not predict how vulnerable an image is. We release the pipeline and the 283 GB dataset.
Figures


Figures from the paper (7 more)



Reference graph
Works this paper leans on
-
[1]
Security audit of Docker container images in cloud architecture
Waheeda Syed Shameem Ahamed, Pavol Zavarsky, and Bobby Swar. Security audit of Docker container images in cloud architecture. InICSCCC 2021, pages 202–207. IEEE, 2021
work page 2021
-
[2]
Open Source, Open Threats? Investigating Security Challenges in Open-Source Software
Seyed Ali Akhavani et al. Open source, open threats? investigating security challenges in open-source software. arXiv preprint arXiv:2506.12995, 2025
work page Pith review arXiv 2025
-
[3]
Vexed by VEX tools: Consistency evaluation of container vulnerability scanners
Yekatierina Churakova et al. Vexed by VEX tools: Consistency evaluation of container vulnerability scanners. InFPS 2025, Lecture Notes in Computer Science, pages 139–156, 2025
work page 2025
-
[4]
An empirical analysis of the Docker container ecosystem on GitHub
Jürgen Cito et al. An empirical analysis of the Docker container ecosystem on GitHub. InMSR 2017, pages 323–333. IEEE, 2017
work page 2017
-
[5]
Secrets revealed in container images: An internet-wide study on occurrence and impact
Markus Dahlmanns et al. Secrets revealed in container images: An internet-wide study on occurrence and impact. InASIA CCS ’23, pages 797–811. ACM, 2023
work page 2023
-
[6]
Empirical study of the Docker smells impact on the image size
Thomas Durieux. Empirical study of the Docker smells impact on the image size. InICSE 2024. ACM, 2024
work page 2024
-
[7]
Omar Javed et al. Understanding the quality of container security vulnerability detection tools.arXiv preprint arXiv:2101.03844, 2021
arXiv 2021
-
[8]
Bhupinder Kaur et al. An analysis of security vulnerabilities in container images for scientific data analysis.GigaScience, 10(6):giab025, 2021
work page 2021
Show all 20 references
-
[9]
SoK: Taxonomy of attacks on open-source software supply chains
Piergiorgio Ladisa et al. SoK: Taxonomy of attacks on open-source software supply chains. InS&P 2023, pages 1509–1526. IEEE, 2023
2023
-
[10]
Understanding the security risks of Docker Hub
Peiyu Liu et al. Understanding the security risks of Docker Hub. InESORICS 2020, volume 12308 ofLecture Notes in Computer Science, pages 257–276. Springer, 2020
2020
-
[11]
How bad can it git? characterizing secret leakage in public GitHub repositories
Michael Meli et al. How bad can it git? characterizing secret leakage in public GitHub repositories. InNDSS 2019. Internet Society, 2019
2019
-
[12]
Longitudinal risk-based security assessment of Docker software container images.Computers & Security, 135:103478, 2023
Alan Mills et al. Longitudinal risk-based security assessment of Docker software container images.Computers & Security, 135:103478, 2023
2023
-
[13]
The Docker Hub image inheritance network: Construction and empirical insights
Ruben Opdebeeck et al. The Docker Hub image inheritance network: Construction and empirical insights. InSCAM. IEEE, 2023
2023
-
[14]
Fixing Dockerfile smells: An empirical study
Giovanni Rosa et al. Fixing Dockerfile smells: An empirical study. InICSME 2022. IEEE, 2022
2022
-
[15]
Propagation-based vulnerability impact assessment for software supply chains
Bonan Ruan et al. Propagation-based vulnerability impact assessment for software supply chains. InASE, 2025
2025
-
[16]
Hequan Shi et al. Dr. Docker: A large-scale security measurement of Docker image ecosystem. InWWW ’25. ACM, 2025
2025
-
[17]
A study of security vulnerabilities on Docker Hub
Rui Shu et al. A study of security vulnerabilities on Docker Hub. InCODASPY ’17, pages 269–280. ACM, 2017
2017
-
[18]
The ripple effect of vulnerabilities in Maven central: Prevalence, propagation, and mitigation challenges
Ehtisham Ul Haq et al. The ripple effect of vulnerabilities in Maven central: Prevalence, propagation, and mitigation challenges. arXiv preprint arXiv:2504.04175, 2025. 5Code and dataset: https://github.com/ChimangoScan/chimangoscan 6Generative AI tools assisted with writing a...
2025 arXiv
-
[19]
Vulnerability analysis of 2500 Docker Hub images
Katrine Wist et al. Vulnerability analysis of 2500 Docker Hub images. InAdvances in Security, Networks, and Internet of Things, Transactions on Computational Science and Computational Intelligence, pages 307–327. Springer, 2021
2021
-
[20]
On the relation between outdated Docker containers, severity vulnerabilities, and bugs
Ahmed Zerouali et al. On the relation between outdated Docker containers, severity vulnerabilities, and bugs. InSANER 2019, pages 491–501. IEEE, 2019
2019
Reviewed August 6, 2026 · model on record in the stance chip above.
Discussion (0). Sign in to comment.