FinTSB: A Comprehensive and Practical Benchmark for Financial Time Series Forecasting
Pith reviewed 2026-05-23 02:47 UTC · model grok-4.3
The pith
FinTSB benchmark categorizes stock movements into four parts, standardizes metrics in three dimensions, and models trading constraints to fix evaluation gaps.
A machine-rendered reading of the paper's core claim, the machinery that carries it, and where it could break.
Core claim
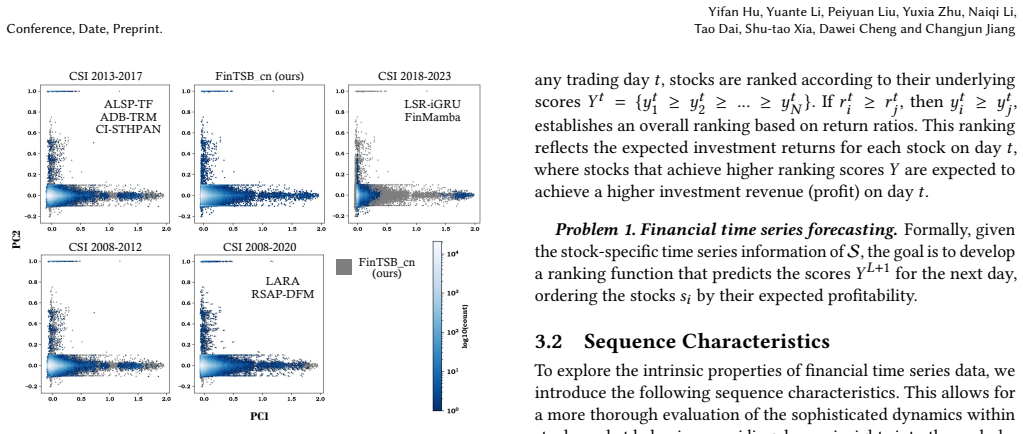
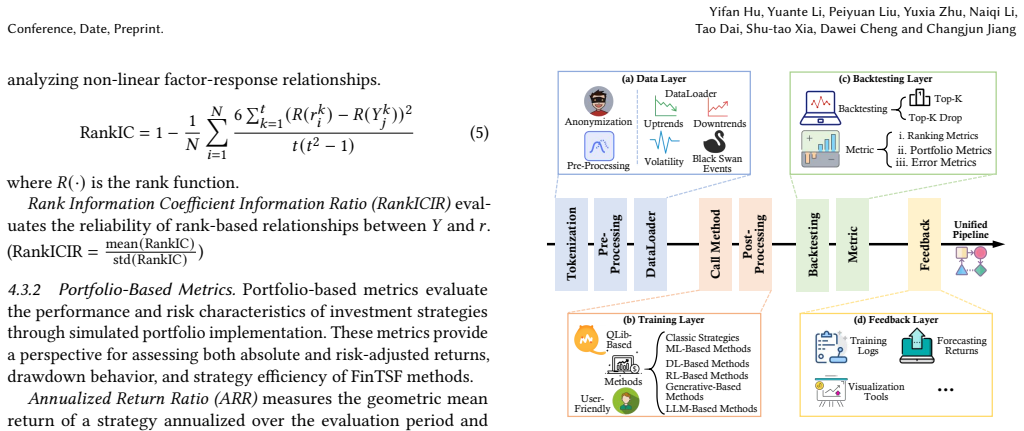
FinTSB is a benchmark that increases variety by categorizing movement patterns into four specific parts, tokenizing and preprocessing data, and assessing quality via sequence characteristics; eliminates biases by standardizing metrics across three dimensions and providing a lightweight pipeline for methods from various backbones; and models regulatory constraints including transaction fees to simulate real trading scenarios, enabling extensive experiments that highlight insights for model selection under varying conditions.
What carries the argument
FinTSB benchmark, which applies four-part movement pattern categorization, three-dimension metric standardization, and regulatory constraint modeling to produce practical evaluations.
If this is right
- Methods built on different backbones can be compared directly without biases from varying evaluation settings.
- Reported performance numbers will incorporate transaction fees and other constraints rather than remaining inflated.
- Experiments on the benchmark supply concrete guidance for choosing models suited to particular market conditions.
- Researchers obtain a single platform and pipeline for consistent improvement and testing of forecasting approaches.
Where Pith is reading between the lines
- Widespread use could redirect research effort toward methods that remain effective once fees and constraints are included.
- The same structure of pattern categorization plus constraint modeling might transfer to forecasting tasks in regulated domains such as energy or logistics.
- If new market regimes appear that do not fit the four categories, the taxonomy itself could be empirically extended using additional sequence data.
Load-bearing premise
Dividing all observed stock movement patterns into four specific categories is sufficient to cover the diversity present in dynamic financial markets.
What would settle it
A collection of real financial time series sequences whose movement patterns fall outside the four defined categories or produce inconsistent method rankings even after the proposed standardization is applied.
Figures


read the original abstract
Financial time series (FinTS) record the behavior of human-brain-augmented decision-making, capturing valuable historical information that can be leveraged for profitable investment strategies. Not surprisingly, this area has attracted considerable attention from researchers, who have proposed a wide range of methods based on various backbones. However, the evaluation of the area often exhibits three systemic limitations: 1. Failure to account for the full spectrum of stock movement patterns observed in dynamic financial markets. (Diversity Gap), 2. The absence of unified assessment protocols undermines the validity of cross-study performance comparisons. (Standardization Deficit), and 3. Neglect of critical market structure factors, resulting in inflated performance metrics that lack practical applicability. (Real-World Mismatch). Addressing these limitations, we propose FinTSB, a comprehensive and practical benchmark for financial time series forecasting (FinTSF). To increase the variety, we categorize movement patterns into four specific parts, tokenize and pre-process the data, and assess the data quality based on some sequence characteristics. To eliminate biases due to different evaluation settings, we standardize the metrics across three dimensions and build a user-friendly, lightweight pipeline incorporating methods from various backbones. To accurately simulate real-world trading scenarios and facilitate practical implementation, we extensively model various regulatory constraints, including transaction fees, among others. Finally, we conduct extensive experiments on FinTSB, highlighting key insights to guide model selection under varying market conditions. Overall, FinTSB provides researchers with a novel and comprehensive platform for improving and evaluating FinTSF methods. The code is available at https://github.com/TongjiFinLab/FinTSB.
Editorial analysis
A structured set of objections, weighed in public.
Referee Report
Summary. The manuscript introduces FinTSB, a benchmark for financial time series forecasting (FinTSF) that targets three limitations in prior work: the diversity gap (failure to cover full spectrum of stock movement patterns), standardization deficit (inconsistent evaluation protocols), and real-world mismatch (neglect of market constraints like transaction fees). It addresses these by categorizing movement patterns into four parts with tokenization and sequence-based quality assessment, standardizing metrics across three dimensions via a lightweight pipeline incorporating multiple backbones, modeling regulatory constraints, and running experiments to derive model-selection insights under varying conditions. The code is released at https://github.com/TongjiFinLab/FinTSB.
Significance. If the four-category categorization, standardized pipeline, and constraint modeling are shown to be comprehensive and bias-free, FinTSB could provide a reproducible platform that enables fairer cross-study comparisons and more practical FinTSF evaluations. The open-source code is a clear strength that supports community adoption and verification.
major comments (3)
- [Abstract, §3] Abstract and §3 (Data Construction): The central claim that categorizing movement patterns into four specific parts, followed by tokenization and sequence-characteristic assessment, closes the diversity gap is not supported by quantitative verification. No table or analysis demonstrates that these four categories capture regime shifts, fat tails, or microstructure events (e.g., flash crashes) beyond the source datasets, leaving the 'full spectrum' assertion untested.
- [§4] §4 (Standardization) and experiments section: The claim that standardizing metrics across three dimensions eliminates evaluation biases lacks explicit definition of those dimensions or before/after comparison showing reduced variance in cross-model rankings. Without such evidence, the pipeline's ability to support valid cross-study comparisons remains unverified.
- [Experiments] Experiments section: The reported insights on model selection under varying market conditions are presented without ablation showing that results change when the four-category split or constraint modeling is removed, making it unclear whether the benchmark itself drives the observed differences versus prior ad-hoc setups.
minor comments (2)
- [§4] Notation for the three standardization dimensions should be introduced with explicit equations or pseudocode in §4 to improve clarity.
- [Figures] Figure captions for any sequence-characteristic plots should include the exact statistics used (e.g., autocorrelation, volatility) rather than generic labels.
Simulated Author's Rebuttal
We thank the referee for the constructive comments, which help clarify areas for improvement in the manuscript. We address each major comment point by point below, indicating planned revisions where appropriate.
read point-by-point responses
-
Referee: [Abstract, §3] Abstract and §3 (Data Construction): The central claim that categorizing movement patterns into four specific parts, followed by tokenization and sequence-characteristic assessment, closes the diversity gap is not supported by quantitative verification. No table or analysis demonstrates that these four categories capture regime shifts, fat tails, or microstructure events (e.g., flash crashes) beyond the source datasets, leaving the 'full spectrum' assertion untested.
Authors: We agree that the manuscript would benefit from explicit quantitative verification. The four categories were empirically derived from observed patterns in the source datasets to span trends, volatility, reversals, and stability. We will add a new analysis subsection and table in §3 that reports statistics on regime shifts (via change-point detection), fat tails (kurtosis and tail indices), and coverage of microstructure events across categories, including examples from the data. revision: yes
-
Referee: [§4] §4 (Standardization) and experiments section: The claim that standardizing metrics across three dimensions eliminates evaluation biases lacks explicit definition of those dimensions or before/after comparison showing reduced variance in cross-model rankings. Without such evidence, the pipeline's ability to support valid cross-study comparisons remains unverified.
Authors: The three dimensions are explicitly the choice of evaluation metrics, the standardization of experimental protocols (e.g., splits and windows), and the inclusion of diverse backbones; however, we acknowledge the need for clearer exposition and supporting evidence. We will revise §4 to provide formal definitions of the dimensions and add a before/after comparison table quantifying the reduction in ranking variance across models. revision: yes
-
Referee: [Experiments] Experiments section: The reported insights on model selection under varying market conditions are presented without ablation showing that results change when the four-category split or constraint modeling is removed, making it unclear whether the benchmark itself drives the observed differences versus prior ad-hoc setups.
Authors: We agree that the absence of explicit ablations leaves the unique contribution of the benchmark components less clear. The current experiments already contrast the standardized pipeline against typical ad-hoc practices in the literature. We will add a discussion subsection in the experiments section that qualitatively contrasts the obtained insights with those from prior non-standardized setups and note the role of the categorization and constraints; a quantitative ablation removing these elements is beyond the scope of the present work but will be flagged for future extension. revision: partial
Circularity Check
No circularity: benchmark assembled from explicit design rules without reduction to fitted values or self-citations
full rationale
The paper constructs FinTSB via explicit categorization rules (four movement patterns), standardization of metrics across three dimensions, and incorporation of external regulatory constraints such as transaction fees. No equations, parameter fitting, predictions, or uniqueness theorems appear in the provided text. The central claims rest on data-processing choices and pipeline design rather than any quantity defined in terms of itself or derived from self-citation chains. This is a standard benchmark paper whose contributions are self-contained against external data and constraints.
Axiom & Free-Parameter Ledger
axioms (1)
- domain assumption Financial markets exhibit four distinct movement pattern categories that together cover the full spectrum of observed behaviors.
Forward citations
Cited by 7 Pith papers
-
From Feedback Loops to Policy Updates: Reinforcement Fine-Tuning for LLM-Based Alpha Factor Discovery
QuantEvolver applies reinforcement fine-tuning to evolve an LLM policy for generating executable alpha factor expressions, yielding higher-quality and more complementary factors than prompt-based baselines on market b...
-
FinSTaR: Towards Financial Reasoning with Time Series Reasoning Models
FinSTaR reaches 78.9% accuracy on a new financial time series reasoning benchmark by applying Compute-in-CoT for deterministic assessments and Scenario-Aware CoT for stochastic predictions.
-
From Observations to States: Latent Time Series Forecasting
LatentTSF improves time series forecasting accuracy and representation quality by shifting prediction from observation space to a learned latent state space via autoencoding.
-
TelecomTS: A Multi-Modal Observability Dataset for Time Series and Language Analysis
TelecomTS is a new observability dataset from 5G networks that preserves absolute scale and supports multi-modal tasks, showing that current time series and language models struggle with abrupt noisy dynamics.
-
FinDocMRE: A Benchmark for Document-Level Financial Multimodal Reasoning Evaluation
FinDocMRE is a new multi-image document-level benchmark spanning 12 financial domains and 5 task types, showing that 11 tested LMMs all score below 65 overall with particular weaknesses in numerical estimation and cro...
-
GCGNet: Graph-Consistent Generative Network for Time Series Forecasting with Exogenous Variables
GCGNet uses a variational generator, graph structure aligner, and graph refiner to jointly capture temporal and channel correlations in time series forecasting with exogenous variables, outperforming baselines on 12 r...
-
Strat-LLM: Stratified Strategy Alignment for LLM-based Stock Trading with Real-time Multi-Source Signals
Strat-LLM demonstrates that LLM trading performance varies by reasoning mode and model scale, with strict alignment reducing drawdowns in downtrends and deep reasoning avoiding small-gain traps.
discussion (0)
Sign in with ORCID, Apple, or X to comment. Anyone can read and Pith papers without signing in.