Recognition: unknown
Deepbullwhip: An Open-Source Simulation and Benchmarking for Multi-Echelon Bullwhip Analyses
Pith reviewed 2026-05-10 12:58 UTC · model grok-4.3
The pith
A modular open-source simulator shows demand variability amplifying 427 times through four supply chain tiers and exposes tradeoffs no single metric captures.
A machine-rendered reading of the paper's core claim, the machinery that carries it, and where it could break.
Core claim
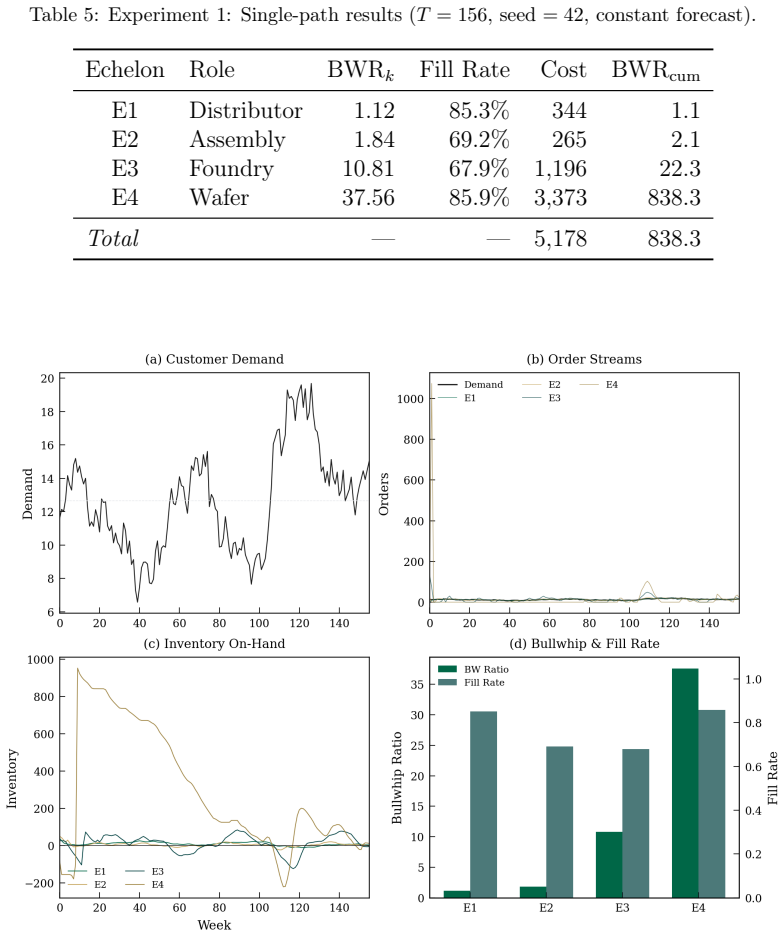
Deepbullwhip supplies a simulation engine for serial multi-echelon chains that uses abstract base classes for demand generators, ordering policies, and cost functions together with a vectorized Monte Carlo engine for 50- to 90-fold speedups. On a four-echelon semiconductor model the engine produces a Monte Carlo mean cumulative amplification of 427 times, a stochastic filtering effect that reduces upstream coefficient of variation to 0.01, super-exponential lead-time sensitivity, and scalability to 20.8 million cells in under seven seconds. Benchmark runs further show a 155 times disparity in bullwhip severity between synthetic AR(1) and real WSTS data under the order-up-to policy, plus BWR-
What carries the argument
The vectorized Monte Carlo engine with pluggable abstract base classes for demand generators, ordering policies, and cost functions, plus a registry of policies, metrics, and datasets.
If this is right
- Demand variability accumulates to a mean of 427 times its original level across four echelons.
- Upstream tiers exhibit stochastic filtering that lowers the coefficient of variation to 0.01.
- Amplification grows super-exponentially as lead times lengthen.
- Real WSTS demand produces 155 times higher bullwhip severity than synthetic AR(1) data under standard policies.
- Ordering policies display clear tradeoffs across the six bullwhip metrics, so single-metric rankings are incomplete.
Where Pith is reading between the lines
- The open registry structure allows quick addition and testing of new ordering policies beyond those initially catalogued.
- Benchmark results imply that future studies should favor real demand datasets over synthetic ones for policy evaluation.
- Demonstrated scalability to millions of cells supports extending the framework to optimize larger or more complex networks.
- The metric disagreements suggest developing composite scores that balance multiple bullwhip measures for policy selection.
Load-bearing premise
The abstract simulation components and the chosen four-echelon semiconductor model accurately reproduce the inventory dynamics and asymmetric costs of real multi-echelon supply chains.
What would settle it
Direct observation of amplification factors far below 427 times or absence of upstream filtering in empirical data from actual semiconductor supply chains would show the reported results do not generalize.
Figures


read the original abstract
The bullwhip effect remains operationally persistent despite decades of analytical research. Two computational deficiencies hinder progress: the absence of modular open-source simulation tools for multi-echelon inventory dynamics with asymmetric costs, and the lack of a standardized benchmarking protocol for comparing mitigation strategies across shared metrics and datasets. This paper introduces deepbullwhip, an open-source Python package that integrates a simulation engine for serial supply chains (with pluggable demand generators, ordering policies, and cost functions via abstract base classes, and a vectorized Monte Carlo engine achieving 50 to 90 times speedup) with a registry-based benchmarking framework shipping a curated catalog of ordering policies, forecasting methods, six bullwhip metrics, and demand datasets including WSTS semiconductor billings. Five sets of experiments on a four-echelon semiconductor chain demonstrate cumulative amplification of 427x (Monte Carlo mean across 1,000 paths), a stochastic filtering phenomenon at upstream tiers (CV = 0.01), super-exponential lead time sensitivity, and scalability to 20.8 million simulation cells in under 7 seconds. Benchmark experiments reveal a 155x disparity between synthetic AR(1) and real WSTS bullwhip severity under the Order-Up-To policy, and quantify the BWR-NSAmp tradeoff across ordering policies, demonstrating that no single metric captures policy quality.
Editorial analysis
A structured set of objections, weighed in public.
Referee Report
Summary. The manuscript introduces Deepbullwhip, an open-source Python package for simulating and benchmarking multi-echelon bullwhip dynamics. It provides a modular engine with abstract base classes for demand generators, ordering policies, and cost functions, a vectorized Monte Carlo simulator (50-90x speedup), and a registry-based benchmarking framework with policies, six metrics, and datasets including WSTS semiconductor data. Five experiments on a four-echelon semiconductor chain report 427x mean cumulative amplification (1,000 paths), upstream CV=0.01 filtering, super-exponential lead-time sensitivity, scalability to 20.8 million cells in <7s, a 155x synthetic AR(1) vs. real WSTS disparity under Order-Up-To, and BWR-NSAmp tradeoffs showing no single metric suffices.
Significance. If the implementation is sound, the work supplies a much-needed open, reproducible platform for multi-echelon bullwhip research that integrates real datasets and complex policies beyond what closed-form analysis can reach. The vectorized engine, multiple-metric benchmarking, and explicit demonstration that policy quality cannot be captured by one number are concrete strengths that could accelerate empirical progress in the field.
major comments (2)
- [Simulation engine and experimental results sections] The headline quantitative claims (427x amplification, 155x disparity, CV=0.01 filtering, lead-time sensitivity) rest entirely on the vectorized Monte Carlo engine correctly implementing serial inventory balance, lead-time delays, and policy logic with asymmetric costs. No cross-validation against closed-form bullwhip ratios is reported for standard base cases (e.g., two-echelon AR(1) demand under Order-Up-To policy, as in Lee et al. 1997). This verification is load-bearing for trusting the reported numbers rather than possible coding artifacts in demand propagation or vectorization.
- [Methods and benchmarking framework] The claim that the reported amplification, filtering, and policy tradeoffs generalize rests on the untested assumption that the abstract base classes and cost-asymmetry handling faithfully reproduce real multi-echelon dynamics; the manuscript provides no empirical calibration or sensitivity checks against observed semiconductor supply-chain data beyond the WSTS billings input.
minor comments (2)
- [Abstract] The abstract and introduction should explicitly state the GitHub repository URL and installation command so readers can immediately access the claimed open-source code and reproduce the 20.8-million-cell scalability timing.
- [Benchmarking framework] Definitions and exact formulas for the six bullwhip metrics (including BWR and NSAmp) and the precise handling of cost asymmetry should be moved from supplementary material into the main text or an appendix table to support independent replication.
Simulated Author's Rebuttal
We thank the referee for the constructive feedback and positive evaluation of Deepbullwhip's potential contribution. We address each major comment below with clarifications and commitments to revision where the points identify verifiable gaps.
read point-by-point responses
-
Referee: [Simulation engine and experimental results sections] The headline quantitative claims (427x amplification, 155x disparity, CV=0.01 filtering, lead-time sensitivity) rest entirely on the vectorized Monte Carlo engine correctly implementing serial inventory balance, lead-time delays, and policy logic with asymmetric costs. No cross-validation against closed-form bullwhip ratios is reported for standard base cases (e.g., two-echelon AR(1) demand under Order-Up-To policy, as in Lee et al. 1997). This verification is load-bearing for trusting the reported numbers rather than possible coding artifacts in demand propagation or vectorization.
Authors: We agree that cross-validation against analytical results is necessary to substantiate the simulation engine. In the revised manuscript we will insert a new verification subsection (likely in Section 3 or an appendix) that replicates the two-echelon AR(1) case under the Order-Up-To policy and directly compares simulated mean amplification and variance against the closed-form bullwhip ratio derived in Lee et al. (1997). This will confirm correct serial inventory balance, lead-time handling, and vectorized sampling before presenting the four-echelon results. revision: yes
-
Referee: [Methods and benchmarking framework] The claim that the reported amplification, filtering, and policy tradeoffs generalize rests on the untested assumption that the abstract base classes and cost-asymmetry handling faithfully reproduce real multi-echelon dynamics; the manuscript provides no empirical calibration or sensitivity checks against observed semiconductor supply-chain data beyond the WSTS billings input.
Authors: We partially agree. The WSTS dataset serves as the primary real-world input to demonstrate the 155x disparity, and the four-echelon parameterization follows documented semiconductor lead times and cost structures. However, we acknowledge that additional sensitivity checks on cost-asymmetry parameters and explicit discussion of calibration limits would strengthen the generalization argument. In revision we will add a dedicated sensitivity subsection and a limitations paragraph clarifying that the abstract base classes are designed for user-supplied calibrated models; we will not claim broader empirical validation beyond the reported WSTS experiments. revision: partial
Circularity Check
No circularity: forward Monte Carlo simulation on explicit rules and external data
full rationale
The paper's core claims consist of numerical outcomes generated by running a vectorized Monte Carlo engine on explicitly defined ordering policies, demand generators, and external datasets (including WSTS semiconductor billings). No equations derive the reported amplification factors, CV values, or policy tradeoffs by fitting back to those same quantities, and no load-bearing step reduces to a self-citation or ansatz that presupposes the results. The derivation chain is the forward application of inventory-balance and lead-time logic to independent inputs, making the reported statistics independent of the metrics they are later summarized by.
Axiom & Free-Parameter Ledger
axioms (1)
- domain assumption Pluggable demand generators, ordering policies, and cost functions via abstract base classes faithfully represent real serial supply-chain dynamics including asymmetric costs.
Forward citations
Cited by 1 Pith paper
-
ISOMORPH: A Supply Chain Digital Twin for Simulation, Dataset Generation, and Forecasting Benchmarks
ISOMORPH is a modular digital twin simulator for supply chain networks that releases datasets exhibiting variance amplification and regime shifts for benchmarking forecasting models and performing forward uncertainty ...
Reference graph
Works this paper leans on
-
[1]
H. L. Lee, V. Padmanabhan, S. Whang, Information distortion in a supply chain: The bullwhip effect, Management Science 43 (1997) 546–
1997
-
[2]
doi:10.1287/mnsc.43.4.546
-
[3]
F. Chen, Z. Drezner, J. K. Ryan, D. Simchi-Levi, Quantifying the bullwhip effect in a simple supply chain: The impact of forecasting, lead times, and information, Management Science 46 (2000) 436–443. doi:10.1287/mnsc.46.3.436.12069. 31
-
[4]
S. M. Disney, D. R. Towill, On the bullwhip and inventory variance produced by an ordering policy, Omega 31 (2003) 157–167. doi:10. 1016/S0305-0483(03)00028-8
2003
-
[5]
Dejonckheere, S
J. Dejonckheere, S. M. Disney, M. R. Lambrecht, D. R. Towill, Mea- suring and avoiding the bullwhip effect: A control theoretic approach, European Journal of Operational Research 147 (2003) 567–590. doi:10. 1016/S0377-2217(02)00369-7
2003
-
[6]
S. M. Disney, Z. Michna, P. Nielsen, The bullwhip effect with correlated lead times and autocorrelated demand, International Journal of Produc- tion Research (2025). doi:10.1080/00207543.2025.2566958, published online 9 October 2025
-
[7]
P. Saoud, N. Kourentzes, J. E. Boylan, The importance of forecast uncertainty in understanding the bullwhip effect, International Journal of Production Research (2025). doi:10.1080/00207543.2025.2527957, published online 9 July 2025
-
[8]
M. Brauch, M. Mohaghegh, A. Größler, Causes of the bullwhip effect: A systematic review and categorization, Management Research Review 47 (2024) 1127–1149. doi:10.1108/MRR-05-2023-0392
-
[9]
Bain & Company, Prepare for the coming AI chip shortage,https://www.bain.com/insights/ prepare-for-the-coming-ai-chip-shortage-tech-report-2024/, 2024
2024
-
[10]
X. Wang, S. M. Disney, The bullwhip effect: Progress, trends and directions, European Journal of Operational Research 250 (2016) 691–
2016
-
[11]
doi:10.1016/j.ejor.2015.07.022
-
[12]
IISE Transactions52(11), 1204–1217 (2020) https://doi.org/10.1080/24725854.2019.1701753
A. Oroojlooyjadid, L. V. Snyder, M. Takáč, Applying deep learning to the newsvendor problem, IISE Transactions 52 (2020) 444–463. doi:10. 1080/24725854.2019.1632502
-
[14]
R. Dominguez, S. Cannella, J. M. Framinan, On bullwhip-limiting strategies in divergent supply chain networks, Computers & Industrial Engineering 73 (2014) 85–95. doi:10.1016/j.cie.2014.04.008
-
[15]
Pattern Recognition , author =
J.K.Sagawa, R.F.S.Borges, Bullwhipeffectanalysisunderdemandun- certainty with correlated demands across retailers, Computers & Indus- trial Engineering 193 (2024) 110309. doi:10.1016/j.cie.2024.110309
- [16]
-
[17]
R. R. Corsini, A. Costa, S. Fichera, J. M. Framinan, Digital twin model with machine learning and optimization for resilient production– distribution systems under disruptions, Computers & Industrial Engi- neering 191 (2024) 110145. doi:10.1016/j.cie.2024.110145
-
[18]
J. D. Sterman, Modeling managerial behavior: Misperceptions of feed- back in a dynamic decision making experiment, Management Science 35 (1989) 321–339. doi:10.1287/mnsc.35.3.321
-
[19]
Fasusi, supplychainpy: Python library for supply chain anal- ysis, modelling and simulation,https://github.com/KevinFasusi/ supplychainpy, 2018
K. Fasusi, supplychainpy: Python library for supply chain anal- ysis, modelling and simulation,https://github.com/KevinFasusi/ supplychainpy, 2018. V0.0.5
2018
-
[20]
Open-source production scheduling and capacity planning platform
frePPLe, frePPLe: Open source supply chain planning,https:// frepple.com, 2024. Open-source production scheduling and capacity planning platform
2024
-
[21]
L. Chen, H. L. Lee, Bullwhip effect measurement and its implications, Operations Research 60 (2012) 771–784. doi:10.1287/opre.1120.1074
-
[22]
S. Makridakis, E. Spiliotis, V. Assimakopoulos, M5 accuracy com- petition: Results, findings, and conclusions, International Journal of Forecasting 38 (2022) 1346–1364. doi:10.1016/j.ijforecast.2021. 11.013
-
[23]
Monthly billings by region and product category, freely downloadable
World Semiconductor Trade Statistics, WSTS blue book: His- torical semiconductor billings data,https://www.wsts.org/67/ Historical-Billings-Report, 2025. Monthly billings by region and product category, freely downloadable. Data through December 2025. 33
2025
-
[24]
J.W.Forrester, IndustrialDynamics, MITPress, Cambridge, MA,1961
1961
-
[25]
Mönch, J
L. Mönch, J. W. Fowler, S. J. Mason, Production Planning and Schedul- ing for Semiconductor Wafer Fabrication, Springer, 2013. doi:10.1007/ 978-1-4614-4472-5
2013
-
[26]
X. Zhang, Evolution of ARMA demand in supply chains, Manufactur- ing & Service Operations Management 6 (2004) 195–198. doi:10.1287/ msom.1040.0042
-
[27]
Gilbert, An ARIMA supply chain model, Management Science 51 (2005) 305–310
K. Gilbert, An ARIMA supply chain model, Management Science 51 (2005) 305–310. doi:10.1287/mnsc.1040.0308
-
[29]
S. Cannella, B. Ponte, R. Dominguez, J. M. Framinan, Proportional order-up-to policies for closed-loop supply chains: The dynamic effects of inventory controllers, International Journal of Production Research 59 (2021) 3323–3337. doi:10.1080/00207543.2020.1867924
-
[30]
Q. Li, G. Gaalman, S. M. Disney, On the equivalence of the proportional and damped trend order-up-to policies, International Journal of Produc- tion Economics 265 (2023) 109008. doi:10.1016/j.ijpe.2023.109008
-
[31]
D. Wright, X. Yuan, Mitigating the bullwhip effect by ordering poli- cies and forecasting methods, International Journal of Production Eco- nomics 113 (2008) 587–597. doi:10.1016/j.ijpe.2007.10.032
-
[32]
Borshchev, The Big Book of Simulation Modeling: Multimethod Modeling with AnyLogic 6, AnyLogic North America, 2013
A. Borshchev, The Big Book of Simulation Modeling: Multimethod Modeling with AnyLogic 6, AnyLogic North America, 2013
2013
-
[33]
W. D. Kelton, R. P. Sadowski, N. B. Zupick, Simulation with Arena, 6th ed., McGraw-Hill, 2015
2015
-
[34]
E. A. Silver, D. F. Pyke, D. J. Thomas, Inventory and Production Man- agement in Supply Chains, 4th ed., CRC Press, Boca Raton, FL, 2017. doi:10.1201/9781315374406. 34
-
[35]
Cachon, C
G. Cachon, C. Terwiesch, Matching Supply with Demand: An Intro- duction to Operations Management, 3rd ed., McGraw-Hill, New York, 2012
2012
-
[36]
P. H. Zipkin, Foundations of Inventory Management, McGraw- Hill/Irwin, Boston, MA, 2000
2000
-
[37]
Gamma, R
E. Gamma, R. Helm, R. Johnson, J. Vlissides, Design Patterns: Ele- ments of Reusable Object-Oriented Software, Addison-Wesley, 1994
1994
-
[38]
Spyros Makridakis, Evangelos Spiliotis, and Vassilios Assimakopoulos
S. Makridakis, E. Spiliotis, V. Assimakopoulos, The M4 competition: 100,000 time series and 61 forecasting methods, International Journal of Forecasting36(2020)54–74.doi:10.1016/j.ijforecast.2019.04.014
-
[39]
K. Chen, J. Wang, J. Pang, Y. Cao, Y. Xiong, X. Li, S. Sun, W. Feng, Z. Liu, J. Xu, Z. Zhang, D. Cheng, C. Zhu, T. Cheng, Q. Zhao, B. Li, X. Lu, R. Zhu, Y. Wu, J. Dai, J. Wang, J. Shi, W. Ouyang, C. C. Loy, D. Lin, MMDetection: Open MMLab detection toolbox and bench- mark, 2019. Software available athttps://github.com/open-mmlab/ mmdetection
2019
-
[40]
Y. Wu, A. Kirillov, F. Massa, W.-Y. Lo, R. Girshick, Detectron2,
-
[41]
Software available athttps://github.com/facebookresearch/ detectron2
-
[42]
R. C. Martin, Agile Software Development: Principles, Patterns, and Practices, Prentice Hall, Upper Saddle River, NJ, 2003
2003
-
[43]
semiconductor industry 2025,https://www.semiconductors.org, 2025
Semiconductor Industry Association, State of the U.S. semiconductor industry 2025,https://www.semiconductors.org, 2025
2025
-
[44]
Confinement and the center of the gauge group,
R. N. Boute, J. Gijsbrechts, W. van Jaarsveld, N. Vanvuchelen, Deep reinforcement learning for inventory control: A roadmap, European Journal of Operational Research 298 (2022) 401–412. doi:10.1016/j. ejor.2021.07.016. 35 Appendix A. Proof of Proposition 1 Proof.LetX= Var(O k |ω)andY= Var(O k−1 |ω)be positive random variables (over the probability space o...
work page doi:10.1016/j 2022
discussion (0)
Sign in with ORCID, Apple, or X to comment. Anyone can read and Pith papers without signing in.